Download
1 / 20
220 likes | 425 Views
MATLAB Session 2. ES 156 Signals and Systems 2007 Harvard SEAS. Prepared by Jiajun Gu. OUTLINE. Programming Functions, scripts Programming control commands Specialized Graphics Bar graph Pie chart Histogram Convolution. Programming in MATLAB: Scripts.

E N D
MATLAB Session 2 ES 156 Signals and Systems 2007 Harvard SEAS Prepared by Jiajun Gu
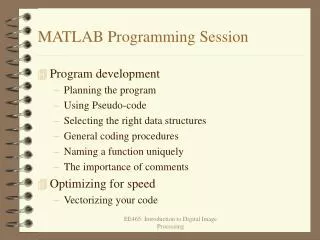
OUTLINE • Programming • Functions, scripts • Programming control commands • Specialized Graphics • Bar graph • Pie chart • Histogram • Convolution
Programming in MATLAB: Scripts • Scripts have no input and output • List of commands • Variables are available on completion • Simple example theta = -pi:0.01:pi; % Computations rho = 2 *sin(5 *theta).^2; polar(theta,rho) % Graphics output
Programming MATLAB: Functions Writing an M-File: function f = fact(n) definition % FACT Factorial. help line % FACT(N) returns the factorial of N % usually denoted by N! % Put simply, FACT(N) is PROD(1:N). f = prod(1:n); % Function body return
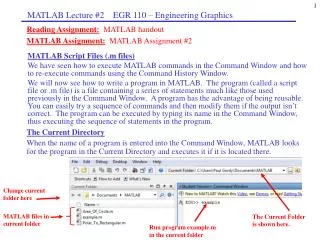
Programming in MATLAB – functions II • Functions have inputs and outputs • Variables defined in the function isn’t defined after function completes evaluating • Call a function [out1, out2,…, outN] = functionname(in1, in2, ..., inN) • A MATLAB function is usually saved as a *.m file with the filename the same as the function name. When a function is being called, MATLAB looks for the filename.
Programming in MATLAB-subfunctions • An M-file can contain code for more than one function. • Additional functions within the file are called subfunctions. • Subfunctions are only visible to the primary function or to other subfunctions in the same file. function [avg, sdv] = mystats(u) % Primary function % mystats finds mean and standard deviation of a vector avg=mean(u); sdv = mysdv(u); function a = mysdv(v) %subfunction a=sum((u-mean(u)).^2)/(length(u)-1); a=sqrt(a);
Flow control If/elseif/else switch/case/otherwise • Logic control structures: • Iterative structures: • Traditional for loop • Matlab vector for loop for while for i=1:10 for j=1:10 a(i,j)=b(i,j)*c(i,j); end end a = b.*c;
Try to avoid for loop Compare the computation time of these two scripts x=1:1e7; s=sum(x) x=1:1e7; s=0; for i=1:1e7 s=s+x(i); end s
Examples- if/else I Construct a tri-diagonal matrix A
Example – if/else II If we write the code into a *.m file, and save it as mytridiag.m. We can execute this script in the main command window by typing Mytridiag a=zeros(5,5); for i=1:5 for j=1:5 if i==j a(i,j)=3; elseif abs(i-j)==1 a(i,j)=1; end end end
Examples- for/while loop • You have a vector with length N-1, all the elements are distinct and belong to the set {1, 2, ……, N}. That is, one integer is not in the vector. Can you find the missing integer? • Write a function with one input (the vector) and one output (the missing integer).
Save as findmiss.m Examples-for/while loop function y=findmiss(x) % x is the input, which is a N-1 vector with distinct elements in 1 to N. % y is the output, that is not in x. indicator=zeros(1,N); for i=1:N-1 indicator(x(i))=1; end for i=1:N if indicator(i)==0 y=i; end end % call function findmiss % simulate the input x x=randperm(N); id=ceil(rand(1)*N); z=x(id); % z is the missing integer % take z out of x x=[x(1:id-1), x(id+1:end)]; y=findmiss(x)
Bar Graphs • bar(Y) draws one bar for each element in Y • bar(x, Y) draws a bar for each element in Y at locations specified in x, where x is a monotonically increasing vector defining the x-axis intervals for the vertical bars. >> x=-2:0.2:2; >> y= exp(-x.*x)/2; >> bar(x,y,'r')
Pie Charts • pie(X) draws a pie chart using the data in X. Each element in X is represented as a slice in the pie chart. • pie(X,explode) offsets a slice from the pie >> x=[2 3 7 4]; >> subplot(2,1,1); >> pie(x) >> subplot(2,1,2); >> explode=[0 0 1 0] >> pie(x,explode)
Histogram • n = hist(Y,nbins) uses nbins number of equally spaced bins, and returns the number of elements in each container. • n = hist(Y,x) where x is a vector, returns the distribution of Y among length(x) bins with centers specified by x. x = -2:0.2:2; y =randn(10000,1); hist(y,x);
Convolution • conv() C = CONV(A, B) convolves vectors A and B. The resulting vector is LENGTH(A)+LENGTH(B)-1
Convolution examples • Find y[n] when • Find y[n] when h2[n] is a rectangular function
Define x[n]: Define h1[n] n=-50:50; x1=zeros(1,50); n2=0:50; x2=(0.5).^n2; x=[x1,x2]; h1=zeros(1,51); h1(25)=1; Convolution –examples Now convolve: y1=conv(x,h1); figure;stem(x, 'k.'); hold on; stem(y1,'r.'); axis tight; legend('x[n]','y1[n]')
Define h2[n] h2=zeros(1,51); h2(26-5:26+5)=1; Now convolve: y2=conv(x,h2); figure; subplot(2,1,1) stem(-25:25,h2,'.'); subplot(2,1,2); stem(-25-50:25+50,y2,'r.'); Convolution –examples
Practice Problem Use conv() to calculate and plot