Download
1 / 27
280 likes | 421 Views
Literature. Kholodenko BN: Cell-signalling dynamics in time and space . Nat Rev Mol Cell Biol 2006, 7 :165-176. Papin JA, Hunter T, Palsson BO, Subramaniam S: Reconstruction of cellular signalling networks and analysis of their properties . Nat Rev Mol Cell Biol 2005, 6 :99-111.

E N D
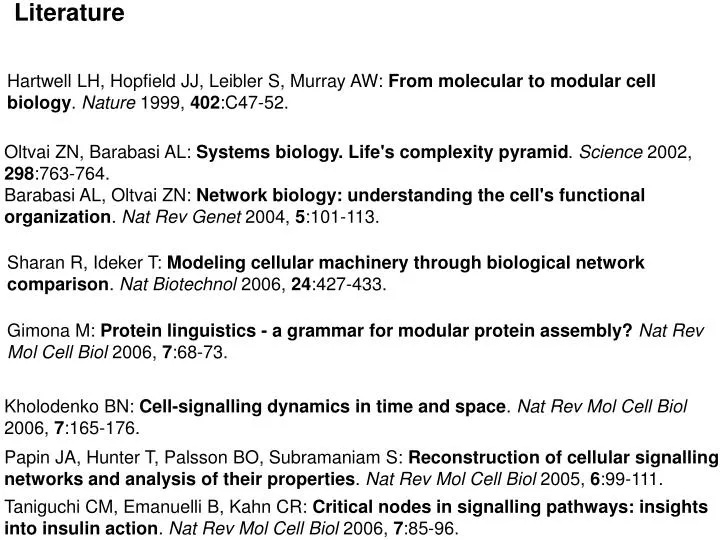
Literature Kholodenko BN: Cell-signalling dynamics in time and space. Nat Rev Mol Cell Biol 2006, 7:165-176. Papin JA, Hunter T, Palsson BO, Subramaniam S: Reconstruction of cellular signalling networks and analysis of their properties. Nat Rev Mol Cell Biol 2005, 6:99-111. Taniguchi CM, Emanuelli B, Kahn CR: Critical nodes in signalling pathways: insights into insulin action. Nat Rev Mol Cell Biol 2006, 7:85-96. Hartwell LH, Hopfield JJ, Leibler S, Murray AW: From molecular to modular cell biology. Nature 1999, 402:C47-52. Oltvai ZN, Barabasi AL: Systems biology. Life's complexity pyramid. Science 2002, 298:763-764. Barabasi AL, Oltvai ZN: Network biology: understanding the cell's functional organization. Nat Rev Genet 2004, 5:101-113. Sharan R, Ideker T: Modeling cellular machinery through biological network comparison. Nat Biotechnol 2006, 24:427-433. Gimona M: Protein linguistics - a grammar for modular protein assembly?Nat Rev Mol Cell Biol 2006, 7:68-73.
essential • allows divergence • facilitate crosstalk • fine tune the response stimuli NATURE REVIEWS | MOLECULAR CELL BIOLOGY VOLUME 7 | FEBRUARY 2006 |
Identification of components, or nodes, within the network Quantitative approaches Integrate biochemical and computational data to identify essential nodes in signalling networks, as well as to describe how these nodes might interact with other signalling cascades. Genetic approach Using data that has been derived from in vitro and in vivo genetic knockout studies Identification of `critical nodes by three criteria • The node must constitute a group of related proteins (for example, gene isoforms) that are essential for the receptor-mediated signal, and in which two or more of these related proteins might have unique biological roles within a signalling network and therefore serve as a source of divergence within the signalling system • The node is highly regulated, both positively and negatively • The node is a junction for potential crosstalk with other signalling systems.
INSULIN SIGNALLING NETWORK 1 3 2 1 ~1000 combinatorial possibilities
Signalling in a nutshell Cells respond to external cues using a limited number of signalling pathways that are activated by plasma membrane receptors, such as G protein-coupled receptors (GPCRs) and receptor tyrosine kinases (RTKs). These pathways do not simply transmit, but they also process, encode and integrate internal and external signals. Recently, it has become apparent that distinct spatio-temporal activation profiles of the same repertoire of signalling proteins result in different gene-expression patterns and diverse physiological responses. For any individual receptor pathway, there is no single protein or gene that is responsible for signalling specificity. Instead, specificity is determined by the temporal and spatial dynamics of downstream signalling components. Upon stimulation, RTKs undergo dimerization (for example, the epidermal growth factor receptor (EGFR)) or allosteric transitions (insulin receptor) that result in the activation of the intrinsic tyrosine-kinase activity. Subsequent phosphorylation of multiple tyrosine residues on the receptor transmits a biochemical signal to numerous cytoplasmic proteins, thereby triggering their mobilization to the cell surface. The resulting cellular responses occur through complex biochemical circuits of protein–protein interactions and covalent-modification cascades.
Intracellular components Modifications The human genome contains ~25,000 genes Alternative splicing: Assuming an average of 2.5 splice variants per gene across the entire genome. 1014 cells that are comprised of more than 200 different cell types Post-translational modifications (PTMs) on average, at least 2.5 modifications per protein The human cellular signalling network includes genes for 1,543 signalling receptors Proteins are also subject to proteolytic events that further regulate their activity. 518 protein kinases and ~150 protein phosphatases. Three independent PTMs would correspond to eight distinct states of a given protein (each of the 3 PTMs could be present or absent, so 23 = 8) Activation (or inhibition) of transcription factors (of which there are estimated to be more than 1,850 in the human genome
Links and connectivity. Interactions between the network components allow for an even greater degree of combinatorial control. Initial estimates of the number of interactions in the yeast proteome indicated that there are an average of five interacting partners per protein IF 1% of the total receptors (15 receptor proteins) can be independently expressed in any given cell type, then the cell could potentially respond to 32,768 different ligand combinations. For example, in metabolic networks, the addition of a single reaction to a network could increase the number of functional pathways by several-fold.
Reconstructions of highly connected ‘NODES’in networks. Such reconstructions involve comprehensively listing the compounds and reactions that are associated with a given protein, ion or metabolite. Identifying SIGNALLING ‘MODULES’. Such modules historically consist of groups of compounds and proteins that function together under certain conditions on the basis of phenomenological reasoning Forming linear ‘pathways’ that connect signalling inputs to signalling outputs.
Universal motifs of cell-signalling networks. One-site phosphorylation cycle. A cascade of cycles. A cycle of a small GTPase (Ran). Negative feedback provides robustness to noise, increases resistance to disturbances inside the feedback loop, but causes oscillations if it is too strong and the cascade is ultrasensitive. Positive feedback greatly increases the sensitivity of the target to the signal and might also lead to bistability and relaxation oscillations.
Protein linguistics — a grammar for modular protein assembly? Linguistic concepts to define a basic set of grammatical rules for genes, based on the idea that mutating a piece of genetic information was similar to modifying words. If the mutation is recognized by an existing automaton, then the structure is preserved, in spite of the mutation. Otherwise, this new structure needs to be recognized by a new automaton or it remains meaningless (a semantic null). A key theoretical principle for understanding an unknown language is the recognition of syntactic patterns. For proteins, these patterns might be similarities in sequence, or structure, or both. NATURE REVIEWS | MOLECULAR CELL BIOLOGY VOLUME 7 | JANUARY 2006 | 69
pathways (level 2), which in turn are the building blocks of functional modules (level 3). These mo- dules are nested, generating a scale-free hierarchical architecture (level 4). Although the individual components are unique to a given organism, the topologic proper- ties of cellular net- works share sur- prising similarities with those of natural and social network and the World Wide Web. From the particular to the universal. The bottom of the pyramid shows the traditional representation of the cell’s functional organization: genome, transcriptome, proteome, and metabolome (level 1). There is remarkable integration of the various layers both at the regulatory and the structural level. Insights into the logic of cellular organization can be achieved when we view the cell as a complex network in which the compo- nents are connec- ted by functional links. At the lowest level, these com- ponents form genetic-regulatory motifs or metabolic
Although molecular biology offers many spectacular successes, it is clear that the detailed inventory of genes, proteins, and metabolites is not sufficient to understand the cell’s complexity. According to the basic dogma of molecular biology, DNA is the ultimate depository of biological complexity. Indeed, it is generally accepted that information storage, information processing, and the execution of various cellular programs reside in distinct levels of organization: the cell’s genome, transcriptome, proteome, and metabolome. These elementary building blocks organize themselves into small recurrent patterns, called pathways in metabolism and motifs in genetic regulatory networks. In turn, motifs and pathways are seamlessly integrated to form functional modules groups of nodes (for example, proteins and metabolites) that are responsible for discrete cellular functions. These modules are nested in a hierarchical fashion and define the cell’s large-scale functional organization. They identified small subgraphs that appear more frequently in a real network than in its randomized version. This enabled them to distinguish coincidental motifs from recurring significant patterns of interconnections. An important attribute of the complexity pyramid is the gradual transition from the particular (at the bottom level) to the universal (at the apex). Lately, we have come to appreciate the power of maps—reliable depositories of molecular interactions. Yet existing maps are woefully incomplete; key links between different organizational levels are missing.
Power-law degree distribution. Relatively small number of highly connected nodes that are known as hubs. Account for the coexistence of modularity, local clustering and scale-free topology The node degrees follow a Poisson distribution
The origin of the scale-free topology and hubs in biological networks. Growth and preferential attachment. Growth means that the network emerges through the subsequent addition of new nodes. Preferential attachment means that new nodes prefer to link to more connected nodes. Growth and preferential attachment generate hubs through a ‘rich-gets-richer’ mechanism: the more connected a node is, the more likely it is that new nodes will link to it, which allows the highly connected nodes to acquire new links faster than their less connected peers.
Yeast protein interaction network. red = lethal,green = non-lethal,orange = slow growth,yellow = unknown.
INSULIN SIGNALLING NETWORK 1 3 2 1 ~1000 combinatorial possibilities
Complementary roles of isoforms (IRS) Though IRS protein structure are highly homologous, they serve complementary rather than redundant roles based on knock out phenotypes Irs1-knockout mice have defective insulin action primarily in the muscle, and a generalized defect in body growth due to IGF1 resistance. Irs1-knockout pre-adipocytes have defects in differentiation Irs2-knockout mice have greater defects in insulin signalling in the liver, and show altered growth in only a few tissues, such as certain neurons and pancreatic β-cells. Whereas Irs2-knockout preadipocytes differentiate normally, but fail to respond to insulin-stimulated glucose transport.
Biochemical studies have revealed several molecular mechanisms by which the IRS proteins could exert their specific effects. Different expression pattern IRS1 and IRS2 are widely distributed, whereas IRS3 is largely limited to the adipocytes and brain, and IRS4 is expressed primarily in embryonic tissues or cell lines. IRS1 and IRS2 have been shown to differ in their ability or affinity to bind to various SH2 partners. Allows selective channelling to downstream effectors IRS1 is found to more closely regulate glucose uptake, whereas IRS2 seems to be more closely linked to MAPK activation. Other variants are modifiers by blocking or attenuating the signalling IRS3 and IRS4 probably modify the actions of IRS1 and IRS2, as they cannot activate MAPK and PI3K to the same degree as IRS1 and IRS2, and might actually antagonize some of their functions when expressed at high levels.


![[virtual] cells](https://cdn1.slideserve.com/3553683/slide1-dt.jpg)