Download
1 / 4
40 likes | 125 Views
Differences in Service Utilization by Disability and Residence. Data Brief Series ● September 2011 ● No.18. In 2006, seniors with moderate or severe disabilities had higher health service utilization than seniors without disabilities?.

E N D
Differences in Service Utilization by Disability and Residence DataBrief Series ● September 2011 ● No.18 In 2006, seniors with moderate or severe disabilities had higher health service utilization than seniors without disabilities?
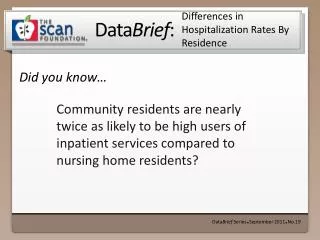
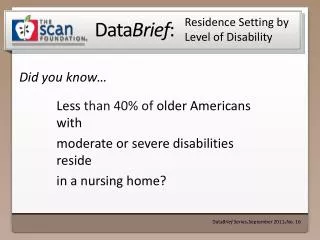
Differences in Service Use by Level of Disability and Residence Setting • Seniors with moderate or severe disabilities typically require significant long-term services and supports (LTSS) to help with every day activities such as eating, bathing, and toileting. This type of care is paid for by Medicaid, out-of pocket payments, private long-term care insurance (LTCi), or provided by family members and friends. • Seniors with moderate or severe disabilities live in a variety of settings such as their homes, residential care including assisted living facilities, or nursing homes.1 • In 2006, Medicare spent nearly 4 times more on health services for seniors with moderate or severe disabilities than those without disabilities. Per capita, Medicare spent $20,030 for seniors with moderate or severe disabilities and $5,719 for seniors without disabilities.2 • In addition, seniors with disabilities had higher health service utilization across all major service lines than those without disabilities. For example, seniors with moderate or severe disabilities had over twice as many emergency department visits and hospital stays as those without disabilities.2 • However, the type of service utilization varies depending on where seniors with disabilities live. While community-residing seniors with moderate or severe disabilities had higher hospital use and home health use than nursing home residents, nursing home residents used outpatient hospital and skilled nursing facilities more frequently than their community-residing peers.2 1 The SCAN Foundation (2011). DataBrief No. 16: Residence Setting by Level of Disability. Accessed on August 19, 2011 at: http://www.thescanfoundation.org/foundation-publications/databrief-no-16-residence-setting-level-disability. 2 Avalere Health, LLC analysis of the 2006 Medicare Current Beneficiary Survey, Cost and Use file. Excludes beneficiaries who died in 2006. DataBrief (2011) ● No. 18
Seniors with Moderate or Severe Disabilities Have Higher Health Services Utilization Than Seniors without Disabilities Claims Per Thousand Medicare Beneficiaries for Select Services by Residence Setting and Disability Levels, 20061 1 Claims are the bills submitted by physicians, hospitals, skilled nursing facilities, home health agencies and hospice agencies for beneficiaries. 2Seniors with moderate or severe disability include community residents with 2 or more Activities of Daily Living (ADL) needs; all nursing home residents are considered to have a moderate or severe disability. N= 1,161,759 community residents with 2+ ADLs, 817,954 nursing home residents, and 23,778,518 seniors without disabilities. Seniors without disabilities includes both community and residential care residents. 3 Difference in the per capita claims between disabled community residents and nursing home residents is statistically significant at the p <0.05 level. DataBrief (2011) ● No. 18
A Clear Policy Connection Seniors with moderate or severe disabilities are among the highest users of health services. In 2006, this group used more services than seniors without disabilities across all major health service lines. Even among seniors with disabilities, utilization varied by residence setting, with community-residing seniors generally having higher utilization of costly inpatient care. The Medicare Shared Savings Program, included in the Affordable Care Act, is one opportunity to improve the management and quality of care for these individuals. The program encourages doctors, hospitals, and other providers to form accountable care organizations (ACOs) to better coordinate patient care and improve communication among providers to enhance the health and experience of care for individuals. This voluntary program will reward ACOs that meet quality standards in addition to cost savings requirements. The Centers for Medicare and Medicaid Services has proposed 65 measures across five quality domains upon which ACOs will be assessed: Patient Experience of Care, Care Coordination, Patient Safety, Preventive Health, and At-Risk Population/Frail Elderly Health. The program is expected to begin operation in January 2012.1 • This analysis is based on the 2006 Medicare Current Beneficiary Survey (MCBS) Cost and Use file, an annual, longitudinal survey of a representative sample of all Medicare enrollees. The MCBS collects information on residence setting, level of disability, health services utilization, and health spending. • This analysis is limited to respondents in the community and residential care settings who indicated that they received help or standby assistance in two or more ADLs (eating, bathing, dressing, toileting, or transferring). It includes all nursing home residents and assumes that all nursing home residents have at least that level of disability. • Residential care is defined as assisted living facilities, retirement communities, continuing care communities, and other types of residential care facilities. • This analysis is also limited to individuals age 65 or older who are enrolled in the fee-for-service, or traditional, Medicare program. It excludes beneficiaries who had any Medicare Advantage spending in 2006. 1 Centers for Medicare and Medicaid Services. Improving Quality of Care for Medicare Patients: Accountable Care Organizations. April 2011. Accessed July 19, 2011. http://www.cms.gov/MLNProducts/downloads/ACO_Quality_Factsheet_ICN906104.pdf. DataBrief (2011) ● No. 18