Download
1 / 34
360 likes | 504 Views
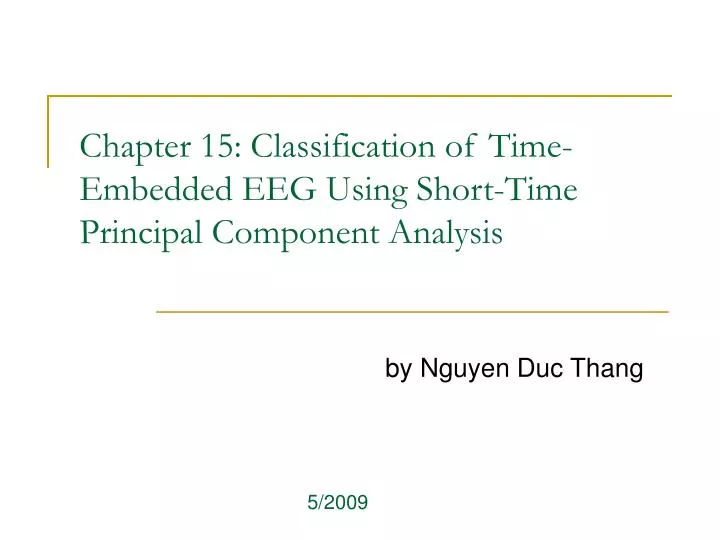
Chapter 15: Classification of Time-Embedded EEG Using Short-Time Principal Component Analysis. by Nguyen Duc Thang. 5/2009. Outline. Part one Introduction Principal Component Analysis (PCA) Signal Fraction Analysis (SFA) EEG signal representation Short time PCA Part two Classifier

E N D
Chapter 15: Classification of Time-Embedded EEG Using Short-Time Principal Component Analysis by Nguyen Duc Thang 5/2009
Outline • Part one • Introduction • Principal Component Analysis (PCA) • Signal Fraction Analysis (SFA) • EEG signal representation • Short time PCA • Part two • Classifier • Experimental setups, results, and analysis
Outline • Overview the previous presentations • Common Spatial Patterns (CSP) • Classifiers • Experimental setups and results • Analysis, discussion, and conclusions
An architecture of EEG-based BCI system PCA, SFA, Short time PCA Feature extraction Classification LDA, SVM
The shortcomings of conventional PCA projection line Not good for large number of samples
Short time PCA approach Apply PCA on short durations
Extract short time PCA features stack n basic vectors D PCA D 1 X Dn n h Time-embedded features Short time PCA features D window h
The role of Singular Value Decomposition (SVD) in PCA w1 Using SVD, we can compute the eigenvector w of covariance matrix Cx (maximize variance) w2
Generalized SVD Maximize variance Using GSVD, we can find generalized eigenvector w that maximizes the variance when projecting data A into w and minimizes the variance when projecting data B into w w A Minimize variance B
Common Spatial Pattern • For 2-classes: • Choose m eigenvectors, that maximize the variance of class A and minimize the variance of class B • Choose m eigenvectors, that maximize the variance of class B and minimize the variance of class A • The basic vectors W = total 2m eigenvectors • Examples: Distinguish left-hand movement and right-hand movement
Common Spatial Pattern • For n-classes (Combine with classifier) • n-classes are converted to n(n-1)/2 2-classes CSP • New trials are assigned to the class for which most classifiers (2-classes) are voting A B (AB), (BC), (CD), (DA), (AC), (BD) D C
Outline • Overview the previous presentations • Common Spatial Patterns • Classifiers • Experimental setups and results • Analysis, discussion, and conclusions
Linear Discriminant Analysis (LDA) • LDA is a simple classification approach in which the samples from each class are modeled by Gaussian distribution
Linear discriminant boundary Boundary
Outline • Overview the previous presentations • Common Spatial Patterns • Classifiers • Experimental setups and results • Analysis, discussion, and conclusions
The parameters of EEG representations l+1 r EEG channels l: the numbers of lags W=[w1,w2,…wf…wf+m…] → choose m basic vectors f is first chosen basic vector Time-embedded features window s is window size
Cross-Validation Training Procedure • The training process • The training trials are randomly partitioned into 80% for constructing classifier and 20% for evaluating • This partition and evaluation process is repeated five times • The set of parameters getting best validation performances are chosen • The testing process • Use the learned parameters to apply to test trials
Experiment 1: Five-task dataset • The subjects perform five mental tasks: (1) resting task, (2) mental letter writing, (3) mental multiplication of two multi-digit number, (4) visual counting, and (5) visual rotation • Each task is repeated five trials • 6 electrodes are used: C3, C4, P3, P4, O1, O2, record each trial 10s/250 Hz
Confusion matrix for short-time PCA representation averaged over test trials
Visualize the classification results • Given a set of samples X={x1,x2,…,xn} that belong to k class and have dimension D>3. How to visualize X ? • For each class, apply K-means clustering to find N cluster points (center of cluster). We have a total K x N points • Using Multidimensional Scale (MDS) to map points in D dimension to d ≤3 (Preserve distance between points)
Three-task dataset • Three subjects perform 3 tasks: imagine left hand movement, imagine right hand movement, and generate words • The subjects perform given task 15s, then switch to another task at the operator’s request • There are three training dataset and one test set of data • EEG signal are recorded at 512 Hz using 32 electrodes
Short-time PCA procedure for three-task dataset • Bandpass-filtered data 8-30 Hz • Down-sampled to 128 Hz • The best parameters from the learning process are given
The other methods • S. Sun et al. remove 7 electrodes, bandpass filtered 8-13Hz (subjects 1-2),11-15 Hz (subject 3) . Multi-class CSP for extract features and SVM for classification • Schlögl et al. downsampled to 128 Hz, extract all bipolar channels (496) +32 monopolar channels. Each channels extract the features: AR (order=3), Bandpower in α and β bands. LDA are used as classifier
The other methods (cont.) • Arbabi et al. downsampled to 128 Hz, filtered to 0.5-45 Hz. Using some statistical features and Bayesian classifier. • Salehi use all raw data, features: PSD and some statistical time domain features (not mentioned). Bayesian classifier
Outline • Overview the previous presentations • Common Spatial Patterns • Classifiers • Experimental setups and results • Analysis, discussion, and conclusions
Improve the classifier performance by smoothing • Many incorrect classification appear as single samples • If n continuous samples have same class, we can decide the majority class • With smoothing, the accuracy is improved from 78.7% to 82.7% (five-task dataset)
Analyze the parameters of EEG representation • Number of lags = 2-3, window size 125, the first basic vector should be early in order, number of basic = 20, subtract mean has minor effects
Analyze the importance of electrodes • The weights of the discriminant functions are summarized corresponding to each electrode • The variances of the weights grouped by this way are plotted • The parietal electrodes are most important for mental task discrimination
Conclusion • This chapter describes a new approach of extracting features from EEG signals by using short-time PCA • For five-mental dataset, combining short-time PCA with simple classifier LDA, this approach achieves 80% accuracy • On three-task dataset, this approach places second among five compared methods • Some analysis about the parameters of the system and the roles of electrodes are also given