Download
1 / 26
300 likes | 1.19k Views
Grade 8 Math Project. Kate D. & Dannielle C. Different Types of Graphs . Box-Whisker. Box-Whisker Graph. Definitions: Extremes: The highest and lowest data values when ordered least to greatest; not including any outliers.

E N D
Grade 8 Math Project • Kate D. & • Dannielle C.
Box-Whisker Graph Definitions: Extremes: The highest and lowest data values when ordered least to greatest; not including any outliers. Median: The middle number when written from least to greatest. If there is an even amount of data values, you take the two middle values, add them together, and divide by 2 to come up with the median. Lower quartile: The median of the lower half of the data. Upper quartile: Median of the upper half of the data. Inter-quartile range: (IQR) The upper quartile minus the lower quartile. Outlier: IQR times 1.5 (Product is subtracted from lower quartile and added to the upper quartiles for values. Anything above or below are outliers.) Outliers are represented with the * symbol. • Information needed to create the graph: • The extremes • The median • Lower quartile • Upper quartile • Any outliers
A E B C D A= The lowest data value (The low extreme) B= The lower quartile C= The median D= The upper quartile E= The highest data value (The high extreme)
Procedure: • The first step taken in this process is to order the data values at the top of the page from least to greatest. So 11,7,2,9,13,18,11,34,19 would then be 2,7,9,11,11,13,18,19,34. • You then take the lowest and highest numbers of your data set and place the low at the far left end and the high at the far right end. It may vary due to outliers, however you will find these in the last step of creating this graph. • Then, you would find the median because in order to find the quartiles, you must know the median first. So by looking at the ordered data, it’s an odd amount of values, so you take the middle number in the data set which in this case is 11. You then write it in the middle line of the box. • Next, you find the quartiles. In order to find the lower quartile, you find the median between the first 11 and 2. In this case, the lower quartile is 8 because it was an even amount causing 7 and 9 to both be in the middle. You then would have to add 7 to 9, which is 16 and divide that by 2 which is 8. Therefore, 8 is your lower quartile. To find the upper quartile you fine the median between 13 and 34. The two numbers in the middle were 18 and 19, so you add them together to get the sum of 37 and divide that by 2 to get 18.5. 18.5 then becomes your upper quartile. • Finally, you see if there are any outliers. To do this you first have to find the inter-quartile range. This is the difference between the upper and lower quartiles. So the difference between 18 and 8 is 10. You then multiply 10 by 1.5 to find the outlier values. This product is 15. To find the outlier limits, you take the outlier value and subtract it from the lower quartile. 2-15 is -13. Knowing we have no negative integers, there are no outliers beyond the low extreme. Then, you add 15 to 18 which is 33. Since the limit is 33, and 34 is one of our values, it is then classified as an outlier. Therefore, the next highest value becomes the high extreme which is 19. To represent the outlier you place a star after the high extreme and write the value underneath.
Bar-Graph • Main uses for Bar Graphs: • To show how something changes over time • Compare items • Plotting data over large areas of time and usually with many significant variations The horizontal and vertical lines that meet at the vertex (0,0) are the x-axis (horizontal line) and the y-axis (vertical line). Y-axis: Typically used to show time or what is being measured X-axis: The information being measured
What does a bar-graph look like? REMEMBER: A key showing what the graph is representing and what each color represents should ALWAYS be included with your graph along with your axes labeled and a title Girls
Procedure: • After collecting all of your data, you should end up with different categories along with different amounts of values • Next, you draw, or create, a graph with a vertical line and a horizontal line meeting at the same vertex, or point. It should look like this: • When you are done drawing or creating the two axes, you then label the horizontal line, or the x-axis with each category from your data. Then you label the vertical line, or the y-axis with numbers usually representing time or the amount of information for each category on the x-axis. • Next you would fill in numbers on the y-axes. Numbers vary in patterns according to your highest value, and how spread out your data is. Then, on the x-axis you would label each category that is in your data. • Following the completion of all labeling and numbering, you would then start graphing. Starting with your first category, you look at how much it represents, then draw a line from the x-axis to the number in which your category value equals and then come back to the x axis making a shape similar to a rectangle. You would then repeat this process for all of your categories. After completing them all, you should then color code them with different colors and create a key to represent the data on your graph. • Lastly, to finish ,you should label your graph with a title. Be sure to have a key, a title, your x and y axes labeled and have it clean and organized.
Histogram A histogram is similar to a bar graph, except that the area over each class interval* is relative to the occurrence of data within this interval. *Class interval: In plotting a histogram, you should start by dividing the range of all values into non-overlapping interval in such a way that every piece of data is contained in some class interval.
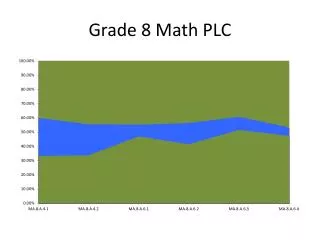
What is a histogram? A histogram is a bar graph of data that creates a picture of the data distribution. • The bars in the histogram represent the frequency of occurrence by classes of data. • A histogram shows basic information about the data set. The histogram’s shape and statistical information help you decide how to improve the system. • To create a histogram, you must know the central location, spread, and the shape. The central location is the center of a set of data points. Mean, median, and mode are the statistics used to describe it.Spread is the range of data from the lowest value to the highest value.
When is it used? • It is used when you need to make predictions about a stable process. If the system is unstable, the histogram will have little predictive value. • To decide if the histogram is the best graph for your data, ask yourself these questions: • Do you have a data set of related values? • Do you need to visualize the central location, spread, and shape of the data? • If yes, then histogram is defiantly the graph you are looking for.
How are Bar-Graphs and Histograms similar? • Bar-Graphs and histograms look very similar, but there are differences. What are they? • In a histogram you have only one variable where as in a bar-graph you have several measurements of different items that you compare. • The main question you ask yourself in a histogram is: How many measurements are there in each of the classes of measurements? The main question you ask yourself in a bar graph is: What is the measurement for each item?
Stem-Leaf Plot What is a stem-leaf plot used for?: *To show data in a small organized chart Only the first value in the number of one of your data values goes on the left of your vertical line and the rest of the numbers go on the right. It is made up of a vertical line used for separation between the first value in the number and all of the rest of the values in the number
1 4 4 4 4 5 5 6 6 8 1 3 5 5 9 5 8 0 7 7 If you have a data set of 67, 45,49, 60, 55,11, 58, 87, 43,45 you would first put them in numerical order This would come to 11, 43, 45, 45, 49, 55, 58, 60, 67, 87 Then you would put them on to your graph starting at the top and working you way down with your least data value at the top and your greatest data value at the bottom. Make sure you only have the first value of your number on the left side and the rest of the values on the right side.
You always need to remember to have a key included at the bottom of you graph to show the value of the numbers. For example if you had a decimal you could not express that in your stem-leaf plot. If your value for example was 6 7 and it was suppose to represent 6.7, at the bottom you would put 6 7 =6.7 so the interpreter of the graph would know that is what the number represents in place value. Also remember that you can have as many numbers on the right side of the vertical line as you need. The way you list your data will also vary on how much information you have in your data set Look on the next slide for an example of this Click here
Ex1 With a data set of 4.56, 4.9, 2.3, 7.69, 6.63, 4.8, 4.8, 8.71 Would bring you to 2.3, 4.56, 4.8, 4.8, 4.9, 6.63, 7.69, 8.71 Put your values on the graph as in ex.1 Also another way your graph could be represented is shown in ex. 2 with the data set of 10, 11,11, 13, 15, 23 2 4 4 4 4 6 7 8 3 56 8 8 9 63 69 71 Ex.2 1 2 0 1 1 3 5 3 3 2 3=2.3 1 0=10
Practice Problems • Create a box-whisker graph with the values 11, 18, 15, 23, 18, 25, 32, 6, 4 • With the following data create a complete bar graph • Tommy interviewed his class on their favorite dessert • Out of the categories of pie, cake, ice cream and cookies, 7 said pie, 3 said cake, 13 said ice cream, and 12 said cookies • What is in the middle place on a box-whisker graph? • I am making a graph but I need to organize my data into some kind of chart. What kind of chart could i use? • With the following data create a stem-leaf plot: 15, 16, 17, 13, 23, 36,26,10 • Using the graph below tell me how many kids picked math as their favorite subjects.
7. In the past half year, you have recorded the number of tickets that a movie theater has sold during each month. Using the following data, construct a histogram
8. In the following stem-leaf plot what is the median number? 9. What is the lower quartile value on the box-whisker graph with the values 14, 16, 17, 18, 20, 22, 23 1 2 3 4 0 1 3 2 1 4 7 0 1 10. In every data set what should you always do first? 1 0=10 Click here for answers
Answers: 1. • The median • A stem-leaf plot 5. 1 1 1 1 1 2 2 3 0 3 5 6 7 3 6 6 4 8.5 18 24 32 To find this answer put your data values in order and follow the steps of a box-whisker graph. 2.
10 kids 7.
31 • 16 • Always put the data set in order first.