Download
1 / 15
150 likes | 236 Views
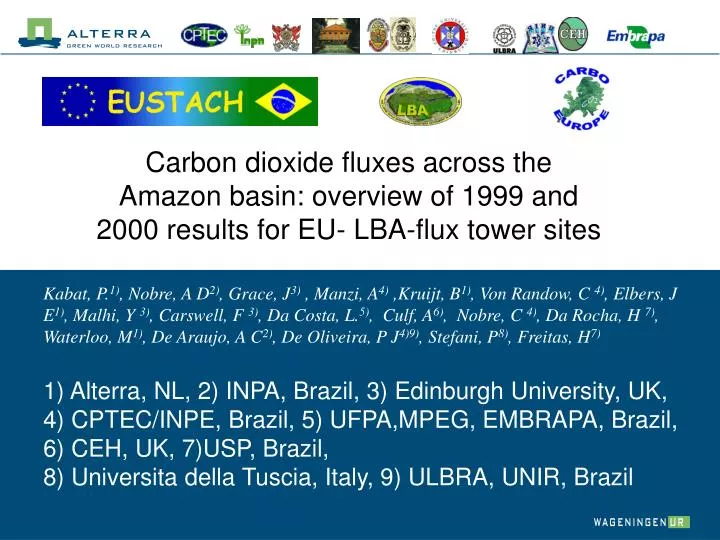
Carbon dioxide fluxes across the Amazon basin: overview of 1999 and 2000 results for EU- LBA-flux tower sites.

E N D
Carbon dioxide fluxes across the Amazon basin: overview of 1999 and 2000 results for EU- LBA-flux tower sites Kabat, P.1), Nobre, A D2), Grace, J3) , Manzi, A4) ,Kruijt, B1), Von Randow, C 4), Elbers, J E1), Malhi, Y 3), Carswell, F 3), Da Costa, L.5), Culf, A6), Nobre, C 4), Da Rocha, H 7), Waterloo, M1), De Araujo, A C2), De Oliveira, P J4)9), Stefani, P8), Freitas, H7) 1) Alterra, NL, 2) INPA, Brazil, 3) Edinburgh University, UK, 4) CPTEC/INPE, Brazil, 5) UFPA,MPEG, EMBRAPA, Brazil, 6) CEH, UK, 7)USP, Brazil, 8) Universita della Tuscia, Italy, 9) ULBRA, UNIR, Brazil
EUSTACH Sites Manaus K34 and Manaus C14 Caxiuana Rebio Jaru Fazenda Nossa Senhora
Towers at Reserva Biologica do Jaru ‘Abracos’ New tower
Methods Eddy correlation: Systems based on ‘Edisol’ (Moncrieff et al, 1996) and ‘Euroflux’ (Aubinet et al, 1999) closed-path principle. Gill-Solent 3-D sonic anemometer Li-Cor 6262 Gas analyser SHORT tube, high pumping rate Calculation: delay removal, 3 rotations, 800s recursive detrend, correction for detrend loss of low frequencies (Except at Caxiuana) Storage fluxes: (in-canopy profiles of CO2 and H2O (CIRAS SC analyser) ) (Not always present) Meteorological data: Automatic weather station, short&long wave radiation, etcetera.
Measured CO2 eddy fluxes over 2 years in the Central and Southern Amazon Data are 10-day averages. Missing data are green or dark blue
Night-time NEE (Storage corrected) fluxes plotted against u* Do we have a problem? ? Uncertainty about 7 t ha-1 y-1 ? ? There is no problem here
7-8 T ha-1y-1 5-6 T ha-1y-1 Seasonal and interannual variation in C flux, annual net uptake
Mean Diurnal trend of CO2 fluxes at four sites • Dry seasons: • Forest peak uptake similar, nights different. • Pasture lower uptake! Dry Wet • Wet seasons: • Forests and pasture very similar.
Where is seasonality in Jaru? Mean Diurnal Cumulative mean diurnal
Where is seasonality in Manaus K34? Mean Diurnal Cumulative mean diurnal
Ecosystem response at monthly time scales Radiation Rainfall
Similarity relations - representativity for surface For all sites the basic s(w)/u* relations are good on average
The effecct of Friagem on CO2 fluxes in Jaru (P.J. Oliveira) Are friagem effects caused by low temperature or are they simply more windy days?
Energy balance closure at Reserva Jaru and Fazenda Nossa Senhora