Download
1 / 9
90 likes | 154 Views
Sports. The table shows the sports participation of students at a school. A Legend tells you what each bar represent. EXAMPLE 2. Making a Double Bar Graph. SOLUTION.

E N D
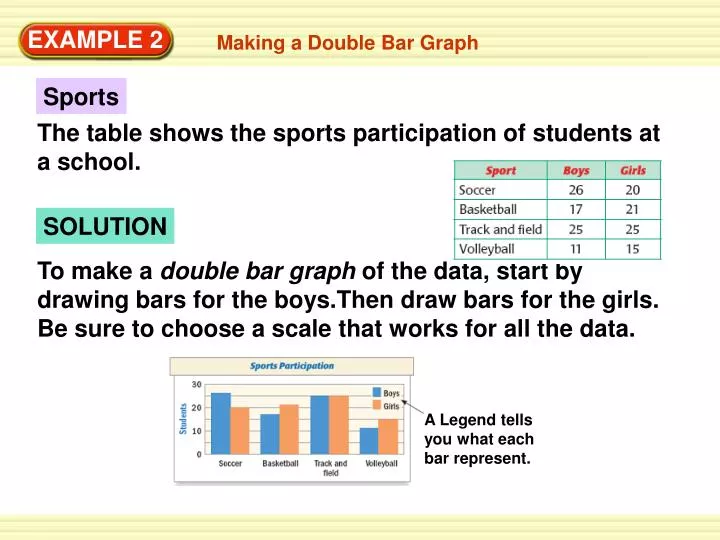
Sports The table shows the sports participation of students at a school. A Legend tells you what each bar represent. EXAMPLE 2 Making a Double Bar Graph SOLUTION To make a double bar graph of the data, start by drawing bars for the boys.Then draw bars for the girls. Be sure to choose a scale that works for all the data.
ANSWER The line graph shows a sharp increase from 1999 to 2000, and a continued decrease from 2000 to 2003. Then the number of entries increased slightly from 2003 to 2004. EXAMPLE 3 Interpreting a Line Graph Hot Air Balloons The line graph shows the number of entries in the Albuquerque Balloon Fiesta from 1999 to 2004. What conclusions can you make about the line graph?
Use the table to make a line graph of the number of cellular phone subscribers from 1998 through 2003. What can you conclude? STEP 1 Choose horizontal and vertical axes. EXAMPLE 4 Making a Line Graph Cell Phones SOLUTION Years from 1998 through 2003 will be shown on the horizontal axis. The greatest number of millions of subscribers is 159. So, start the vertical axis at 0 and end with 200, using increments of 40.
STEP 2 Draw and label the graph. Plot a point for each year. The connect the points with line segment. Include evenly spaced horizontal and vertical gridlines. ANSWER The number of cell phone subscribers climbed steadily from 1998 to 2003 EXAMPLE 4 Making a Line Graph
2 . School Band Make a double bar graph of the data about a school band. for Examples 2, 3 and 4 GUIDED PRACTICE
for Examples 2, 3 and 4 GUIDED PRACTICE ANSWER
3. What conclusions can you make about the double bar graph in Exercise 2 ? ANSWER Sample answer: More eighth graders play the flute than seventh graders. More seventh graders play the clarinet than eighth graders. for Examples 2, 3 and 4 GUIDED PRACTICE
4 . Make a line graph of the number of people in line. for Examples 2, 3 and 4 GUIDED PRACTICE
ANSWER for Examples 2, 3 and 4 GUIDED PRACTICE