Download
1 / 20
200 likes | 309 Views
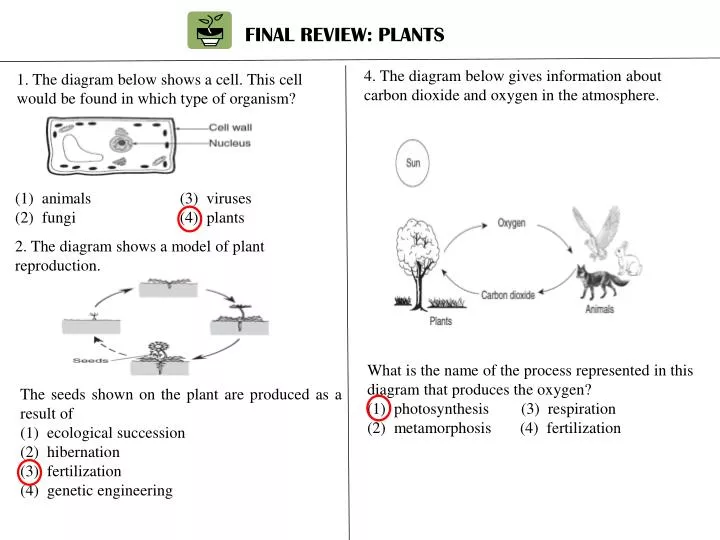
FINAL REVIEW: PLANTS. 4. The diagram below gives information about carbon dioxide and oxygen in the atmosphere. 1. The diagram below shows a cell. This cell would be found in which type of organism?. (1) animals (3) viruses fungi (4) plants

E N D
FINAL REVIEW: PLANTS 4.The diagram below gives information about carbon dioxide and oxygen in the atmosphere. 1. The diagram below shows a cell. This cell would be found in which type of organism? (1) animals (3) viruses • fungi (4) plants 2. The diagram shows a model of plant reproduction. What is the name of the process represented in this diagram that produces the oxygen? (1) photosynthesis (3) respiration (2) metamorphosis (4) fertilization The seeds shown on the plant are produced as a result of (1) ecological succession (2) hibernation (3) fertilization (4) genetic engineering
5. Identify two structures labeled in the diagram, other than the large vacuole, that indicate this cell is a plant cell. 3. The diagram below represents a bean seed that has been cut in half to show its various structures. Which letter represents the stored food that the new plant will use for early development? (1) A (2) C (3) B (4) D • a. ____________________________________ • b. ___________________________________ CHLOROPLAST. CELL WALL 6. Which observation of a plant supports the inference that photosynthesis can take place? (1) a strong, sweet smell (2) a dry, rough texture (3) a green color (4) a smooth stem A- SEED COAT B- ENDOSPERM / COTYLDON C- HILUM D- EMBRYO
*Base your answers to questions 7 – 11 on the information and graph below. A gardener performs an experiment growing three types of plants in equal amounts of soil. Three different types of plants are used. Each plant is 10 centimeters tall at the beginning of the experiment. The three plants are given 4 milliliters of water every day for 20 days. The results of the experiment are shown on the graph. 7. Which plant was the tallest at the end of the 20-day period? 8. Other than at the beginning of the experiment, on what day were plant 2 & 3 the same height? __________ 9. Which plant grew at the slowest rate from day 0 to day 5? _________ 10. During which time interval did plant 1 become taller than plant 3? (1) days 0–5 (3) days 5–10 (2) days 10–15 (4) days 15–20 PLANT 2 DAY 16 PLANT 1 11. The gardener repeated the experiment using identical conditions. Plant 1 grew the fastest. Suggest one change to the experimental design that would help the gardener decide which plant really grows fastest. _____________________________________________________________________________________ START WITH SEEDS BECAUSE THE PLANTS WERE ALREADY 10 CM TALL IN THE FIRST EXPERIMENT.
12. The diagram below shows a leaf that has been partially covered with black paper for three days. When the black paper is removed, the area that was covered by the paper has turned white. The white section of the leaf tests negative for the presence of sugar and the green section tests positive for the presence of sugar. Explain why the white and green sections of the leaf have different sugar test results. _____________________________________________________________________________________ _____________________________________________________________________________________ _____________________________________________________________________________________ THE WHITE SECTION DID NOT MAKE ANY FOOD BECAUSE IT DID NOT RECEIVE ANY LIGHT. THE GREEN SECTION DID PERFORM PHOTOSYNTHESIS AND MADE SUGAR. OR DARK AREA = NO SUN = NO P.S. = NO SUGAR
13. The table below provides some information about common plant cell structures and their functions. In the table, there are three blank spaces. Fill in the three blank spaces by writing the name of the plant cell structure that performs the function described. NUCLEUS CHLOROPLAST CELL WALL
*Base your answers to questions 14-15 on the diagram below that shows relationships in a natural community. 14. Which statement best explains the relationships shown? (1) Water changes over time to a nonrenewable resource. (2) Living things exchange materials with their environment. (3) Minerals recycle the dead materials in the environment. (4) Living things produce other living things. 15. Which process produces oxygen released into the atmosphere? (1) respiration (3) excretion (2) locomotion (4) photosynthesis
*Base your answers to questions 16-18 on the diagram below, which shows the Sun and a green plant. 16. Identify one labeled part that carries on photosynthesis. ___________ 17. In addition to sunlight and chlorophyll, what are the two materials that a plant needs to carry on photosynthesis? (1) _______________________ & (2) ___________________________ 18. Identify one product that results from the process of photosynthesis. _______________________________________________________ LEAF WATER CARBON DIOXIDE GLUCOSE & OXYGEN
19. The diagram below shows a bean plant. Complete the chart below by identifying the three structures labeled A, B, and C. Identify one function of each structure. PHOTOSYNTHESIS, CAPTURE SUNLIGHT, TRANSPORT LEAF SUPPORT LEAVES, TRANSPORT, STORE FOOD STEM ANCHOR PLANT, ABSORB NUTRIENTS & WATER, STORE FOOD ROOT
*Base your answers to questions 20-21 on the diagram of the cell below. Some of the structures are labeled. 20. Which two structures are found in plant cells, but not in animal cells? a. ____________________________, b. ______________________________ 21. Select three of the structures labeled in the diagram key. List these structures in the table below. For each structure selected, state its function in the cell. CELL WALL CHLOROPLAST NUCLEUS DIRECTS ALL CELL FUNCTIONS CONTROLS MOVEMENT OF MATERIALS IN & OUT OF THE CELL CELL MEMBRANE VACUOLE STORE WATER
22. The diagram shows a deer & green plants. Which statement best describes the relationship between the deer and the plants? (1) The deer supplies food and oxygen to the green plants. (2) The deer supplies food and carbon dioxide to the green plants. (3) The green plants supply food and carbon dioxide to the deer. (4) The green plants supply food and oxygen to the deer.
23. Several tomato plants are grown indoors next to a sunny window. The plants receive water and fertilizer & remain on the windowsill. What will most likely happen? (1) Most of the leaves on the window side will wilt and die. (2) The roots of the plants will grow upward from the soil. (3) Water droplets wills collect on the leaves facing away from the window. (4) The stem will bend toward the window. 24. Native Americans would bury dead fish with corn seeds. This technique was used because the decomposing dead fish would (1) provide nutrients for the corn plant (2) eliminate the need for weeding (3) release oxygen for use by the corn plant (4) supply all the water needed by the plant 28. This green plant carrying on photosynthesis. PHOTOTROPISM Identify two things shown in the diagram that the plant needs for photosynthesis to occur. (1) (2) CARBON DIOXIDE, WATER, SUNLIGHT , CHLOROPHYLL
25. All living organisms are dependent on plants because plants (1) produce carbon dioxide (2) remove oxygen from the air (3) are producers • are consumers *Base your answers to questions 26-27 on the diagrams and key below, which shows two cells and some of their structures. 29. The diagram below shows a green plant. What is the main function of the plant structure labeled A? (1) reproduction (3) release of minerals of water (2) absorption (4) support 30. The diagram below shows a cross section of a bean seed. 26. List two structures that are found in both plant and animal cells. (1) _______________ (2)_______________ 27. Which structure shown in the plant cell diagram is the site of photosynthesis? The function of part X in the bean seed is to (1) provide protection for the embryo (2) provide nutrients for the embryo (3) prevent mutations in the plant (4) fight off infections in the plant NUCLEUS CYTOPLASM CHLOROPLAST
*Base your answers to questions 35-36 on the diagram of a green plant. Four parts are labeled A-D. 31. Grasses, shrubs, and trees are called producers because they make (1) water (3) minerals (2) carbon dioxide (4) food *Base your answers to questions 32-33 on the diagram below which shows a process that occurs in the leaf of a tree and other organisms containing chlorophyll. Energy, carbon dioxide, and water are taken in by the leaf and oxygen and sugar are produced. 35. Which part of the plant is involved in sexual reproduction? (1) A (2) C (3) B (4) D 36. Where does the most photosynthesis occur? • (1) A (2) C (3) B (4) D • 37. Which structure is found in a plant cell but not in • an animal cell? • (1) cell wall (3) cytoplasm • (2) cell membrane (4) nucleus 32. What process is occurring? ___________________________ 33. What form of energy is being taken in by the leaf? ___________________________ PHOTOSYNTHESIS LIGHT
38. Which statement describes a method of sexual reproduction that occurs in plants? (1) Stem cuttings are placed in water and grow roots. (2) Seeds are produced from the flower of the plant. (3) Underground stems from a plant grow into new plants. (4) A leaf falls to the soil, develops roots, and grows. 39. What is the outermost structure in a plant cell? (1) cell membrane (3) cell wall (2) cytoplasm (4) chloroplast 40. All plants and animals have mechanisms that (1) transport nutrients (2) perform photosynthesis (3) regulate nerves (4) produce flowers 34. The diagram shows several organisms in a fish tank. Which organism produces oxygen? (1) plant (3) snail (2) water (4) rock
41. A group of students placed the same species of a water plant in five identical test tubes. The test tubes were filled with water and placed at different distances from a light source. After a few minutes, bubbles began to appear in the test tubes, indicating that photosynthesis was occurring. The students counted and recorded the number of bubbles per minute that appeared in each of the test tubes. The results are shown in the data table below. Predict the number of bubbles per minute that would appear if a test tube were placed 80 cm from the light source. bubbles per minute 3
42. Which sequence represents the order of development for many plants? (1) seed develops inside fruit → seed is dispersed → seed germinates → plant grows (2) seed is dispersed → seed develops inside fruit → seed germinates → plant grows (3) seed germinates → plant grows → seed is dispersed → seed develops inside fruit • seed is dispersed → plant grows → seed germinates → seed develops inside fruit *Base your answers to questions 43 and 44 on the graph below. The graph shows the results of an experiment that tested the effect of time on the growth of a plant. A student measured the height of several plants for ten weeks and determined the average height. The results are shown in the graph. 43. Identify three things that should be held constant during this experiment. (1) ________________________________________________ (2) ________________________________________________ (3) ________________________________________________ 44. According to the graph, what will the average height of the plants be at week 11 if growth continues at the same rate as in weeks 8 through 10? ____________ cm. TYPE OF PLANT, ORIGINAL PLANT HEIGHT AMOUNT OF: WATER, SUN FERTILIZER, SOIL TYPE OF CONTAINER, 9.5
*Base your answers to questions 45 and 46 on the graph below and on your knowledge of science. The graph shows the concentration of carbon dioxide in parts per million (ppm) in the atmosphere over several years. 45. Based on the graph, predict the month in 2007 when the concentration of atmospheric carbon dioxide would have been highest. _____________________________________ 46. The general trend in the graph shows an increase in atmospheric carbon dioxide levels from 2002 to 2006. Describe one human activity that may have produced this increase. ______________________________________ ______________________________________ MAY INCREASED POLLUTION, DEFORESTATION, ETC…
*Base your answers to questions 47-48 on the information below. A student conducted an experiment to • find out if air temperature affected the total number of seeds that germinate. Two groups of 100 identical • seeds were used. One group was kept at a temperature of 10°C and the other at 20°C. All other conditions • were held constant. Observations made during the experiment are shown in the data table below. 47. On the graph below, plot with an X the total number of seeds that germinated at 20°C for each day of observation. Connect the Xs with a line. Note: The graph shows the total number of seeds that germinated at 10°C. 48. Using the graph that shows the total number of seeds that germinated at 10°C, determine how many seeds would have germinated at 10°C by day 12. Total Number of Seeds = ____________ 28 SEEDS
*Base your answers to questions 49-51 on the information and table below. A farmer grows and sells flowering plants. The best-selling plants are the ones with the most blossoms. The farmer buys new plant food that claims to make plants grow faster and taller. The farmer predicts that taller plants will have more blossoms and performs the following experiment to test this hypothesis. Two groups of 10 plants each are grown in identical pots filled with equal amounts of identical soil. The amount of sunlight, the room temperature, and the amount of water are constant for both groups. Group A is given plant food at regular intervals according to the instructions on the package. Group B is not given plant food. The farmer observes the plants after 15 weeks of growth. The results are recorded below. 49. State the farmer’s original hypothesis. ___________________________________________________ 50. Based on the results of this experiment, is the farmer’s original hypothesis correct? Circle one: Yes No Explain your answer _____________________________________________ 51. Explain why the amount of sunlight, the room temperature, and the amount of water were held constant for both groups. _________________________________________________________________ IF TALLER PLANTS HAVE MORE BLOSSOMS, THEN PLANTS GIVEN PLANT FOOD WILL HAVE MORE BLOSSOMS. GROUP A WERE TALLER BUT THE BLOSSOMS WERE THE SAME. TO ENSURE A FAIR EXPERIMENT & REDUCE ERROR.
*Base your answers to questions 52-55 on the information and diagrams below. Saltwater plants of the same species were grown in soil in separate containers with 1 liter of water. All of the plants were the same height at the beginning of the experiment. Different amounts of salt were dissolved in each container as shown in the diagrams. All other conditions were held constant. Measurements for the final height of each plant are provided. 52. Draw a line graph on the grid above. 53. How tall would the same type of plant grow in 1 liter of water with 2.5 grams of salt added? ______ cm. 54. State a conclusion. __________________________________________________________________ 55. Identify conditions that need to be kept constant. ___________________________________________ 5 SALTWATER PLANTS GROW BETTER IN VERY SALTY WATER. AMOUNT OF WATER, TYPE & SIZE OF PLANT, ENVIRONMENT, TYPE OF SALT ADDED…