Download
1 / 14
140 likes | 149 Views
This progress report discusses the simulation of GOES data to test its impact in comparison with real data for simulation experiments. The report includes procedures for producing radiance data, cloud clearing algorithms, and estimation of required resources.

E N D
Progress Report I:Simulation of GOES Radiances for OSSE Tong Zhu1, F. Weng1, J. Woollen2, M. Masutani2, S. Lord2, Y. Song2, Q. Liu1, S. A. Boukabara1 Ronald Errico3 1. NOAA/NESDIS/STAR, Camp Springs, MD 2. NOAA/NWS/NCEP/EMC, Camp Springs, MD 3. NASA/GSFC/GMAO, Greenbelt,MD
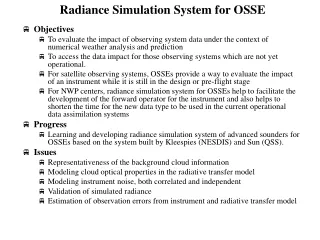
Objective GOES data is simulated to test impact of GOES in simulation experiments in comparison with impact of real data. OSSE for GOES will serve as a calibration for GOESR OSSE.
Procedures NCEP and NESDIS are working to set up the scripts to produce radiance data while GMAO is developing a sampling method, cloud clearing algorithm, and error assignment for simulated radiance data. In this work data for cloudy areas will be simulated and TCC values (or other values) to help with cloud masking will be attached for use in quality control. A pre-processor will be written to discard radiances for cloudy conditions. This work also include estimation of resources required. When GMAO is ready with the cloud clearing algorithm, that will be included as a pre-processor.
DB91L Input data set for CRTM to simulate radiance data. The data set contains 91 level nature run variables horizontally interpolated to an observation point without vertical interpolation. Selected model level data and all surface data are included. Climatological data (such as vegetation surface type) are processed separately. The orbital pattern data are extracted from BUFR dump files. DB91L includes all necessary information need to simulate radiance from NR and BUFR dump files. DB91L can be saved either every 6 hours or 6 minutes depending on the amount of data. DB91L data will be saved in binary format.
GOES-R ABI vs. Current GOES Current GOES vs. GOES-R Current GOES Imager IR band has 4 km horizontal resolution (FOV), GOES Sounder has 10 km resolution. A full disk scan has total 10,080,910 observation points, and takes about 26 min. GOES-R ABI sensor will has 1km/2 km resolution.
Radiance Simulation Flow Chart ECMWF T511 NR GOES-12 Viewing Geometry Surface parameters Atmospheric profiles CRTM GOES Radiance Validation
A full disk scan has total 10,080,910 observation points for 4 km resolution Reduced to ~20 km, 403239 points Reduced to ~60 km, 40323 points GOES EAST Observation Locations
DBL91 dataset format -by Jack Woollen lon= 278.7000122 lat= 80.83999634 dt= -0.2498998642 ( 4 60 6 91 ) .12513 iv=27 ! low vegetation cover .00000 iv=28 ! high vegetation cover 9.00000 iv=29 ! low vegetation type .00000 iv=30 ! high vegetation type .33050 31 Sea-ice cover [(0-1)] .78305 32 Snow albedo [(0-1)] ............ .75516 243 Forecast albedo [(0 - 1)] .00120 244 Forecast surface roughness [m] -8.27367 245 Forecast log of surface roughness for heat pres(pa) cloud cov cloud ice cloud h2o ozone mmr tempature spf humid iv=248 iv=247 iv=246 iv=203 iv=130 iv=133 .1000E+01 .0000E+00 .0000E+00 .0000E+00 .1410E-05 .1946E+03 .8109E-06 .2990E+01 .0000E+00 .0000E+00 .0000E+00 .2750E-05 .2135E+03 .1356E-05 .5684E+01 .0000E+00 .0000E+00 .0000E+00 .2489E-05 .2273E+03 .1967E-05 .1015E+02 .0000E+00 .0000E+00 .0000E+00 .1856E-05 .2396E+03 .2716E-05 .1716E+02 .0000E+00 .0000E+00 .0000E+00 .1442E-05 .2502E+03 .3463E-05 .2768E+02 .0000E+00 .0000E+00 .0000E+00 .1559E-05 .2569E+03 .4011E-05 .4285E+02 .0000E+00 .0000E+00 .0000E+00 .2007E-05 .2581E+03 .4109E-05 .6396E+02 .0000E+00 .0000E+00 .0000E+00 .2480E-05 .2550E+03 .4110E-05 60 Variables 91 Levels
NR CRTM GOES Imager 3.9 µm 6.5 µm 13.3 µm 10.7 µm
NR CRTM GOES Sounder 14.7 µm 14.4 µm 14.1 µm 13.6 µm 13.4 µm 12.7 µm 12.0 µm 11.0 µm 9.7 µm 7.5 µm 7.0 µm 6.5 µm 4.57 µm 4.52 µm 4.45 µm 3.74 µm 4.13 µm 3.98 µm
NR CRTM SEVIRI 0.635 µm 0.81 µm 1.64 µm 3.9 µm 6.25 µm 7.35 µm 8.7 µm 9.66 µm 10.8 µm 12.0 µm 13.4 µm
Summary This work showed that data are processed reasonably. Decoding, interpolation, and CRTM are working. Weather patterns in presented figures are produced by water and ice in the cloud. These radiance data are most likely contaminated by cloud and are not assimilated by DAS. Since GSI simulates radiance as a clear radiance, simulating only clear radiance is considered to be the first step. Various sampling strategies are considered.