Download
1 / 15
150 likes | 283 Views
Why Draw A Sample? . Why not just the get the whole enchilada? Pragmatic reasons The true population is typically “unknowable” When done right, a small proportion of the population works just fine…. Types of Sampling. Probability Sampling Based on the principles of probability theory

E N D
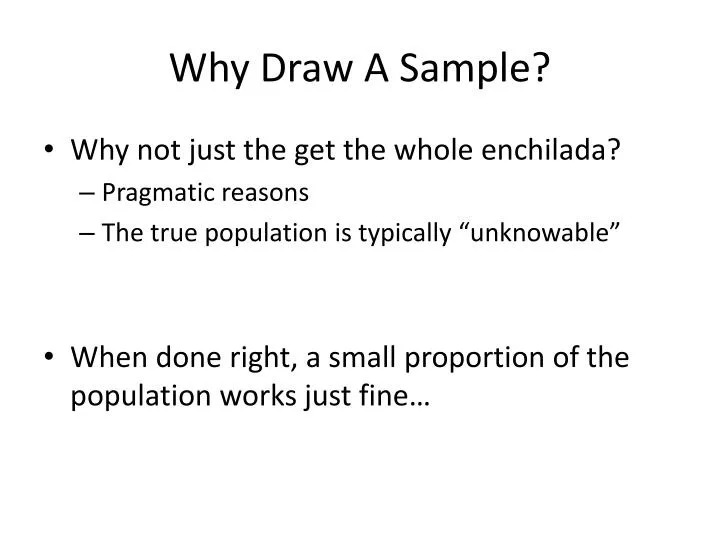
Why Draw A Sample? • Why not just the get the whole enchilada? • Pragmatic reasons • The true population is typically “unknowable” • When done right, a small proportion of the population works just fine…
Types of Sampling • Probability Sampling • Based on the principles of probability theory • Elements of the population have some known probability (typically equal odds) of selection • Non-probability sampling • Elements in the population have unknown odds of selection • Make it very difficult to generalize findings back to the population of interest
Probability Sampling • Terminology • Element • Population • Sample • Sampling Frame • Parameter vs. Statistic
Probability Sampling • Advantages • Avoids both conscious and unconscious bias • By using probability theory, we can judge the accuracy of our findings • There is ALWAYS ERROR in any sample • No sample perfectly reflects the entire population • Key issue = How much error is likely in our specific sample?
Probability Theory • A branch of mathematics that allows us to gauge how well our samplestatistics reflect the true populationparameters. • Based on HYPOTHETICAL distributions • What would happen if we took an infinite number of unbiased (random) samples from a population and plotted the results? • Some “weird” findings just by chance (large errors) • Findings closer to the true parameter more likely (small errors) • Population parameter is most likely outcome (top of curve)
Probability Theory II • Hypothetical distributions are called: • Sampling distributions • Because they are based on drawing an infinite # of samples • Probability distributions • Because they tell us the probability of obtaining particular sample outcomes • Sampling/probability distributions exist for any kind of sample outcome you can imagine • ALL OF THEM PRODUCE “KNOWN” ESTIMATES OF ERROR
Probability Theory III • Standard error • The standard deviation of a sampling/probability distribution • KEY POINT: standard deviations for normal (bell shaped) sampling distribution always contain the same percent of sample outcomes • +/-1 Standard Error contains 68% of outcomes • +/- 1.96 Standard Errors contains 95% of outcomes • +/- 2.58 Standard Errors contains 99% of outcomes
Sampling Distribution .95 95% of all sample outcomes (from infinite number of samples) will be within this window 0.95 True PopulationParameter -1.96 1.96 Standard Errors 5% of the time, you would get a weird finding this different from the true parameter
Probability Theory IV • From sampling distribution to our single sample • IF: 95% of sample statistics (assuming an infinite number of samples) fall within +/- 1.96 standard errors of the true population parameter • Then, there is a 95% chance that our single statistic falls within 1.96 standard errors of the population parameter • SO- we “go out” 1.96 (or 2.58 for 99% confidence) standard errors to create a confidence interval
Calculating what one standard error is “worth” for your sample outcome • The calculations always include • Sample size (N) • Some estimate of dispersion • There are formulas for every situation • Babbie The “Binomial” • Used for agree/disagree questions (% agree) in polling data
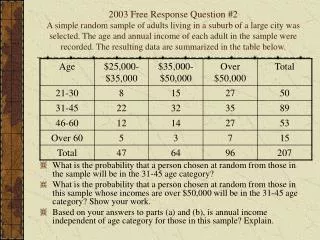
Example: Feb 12, 2009 Gallup Poll On Darwin’s Birthday, Only 4 in 10 Believe in Evolution: Belief drops to 24% among frequent church attendees • “PRINCETON, NJ -- On the eve of the 200th anniversary of Charles Darwin's birth, a new Gallup Poll shows that only 39% of Americans say they "believe in the theory of evolution," while a quarter say they do not believe in the theory, and another 36% don't have an opinion either way. These attitudes are strongly related to education and, to an even greater degree, religiosity.” Survey Methods • “Results are based on telephone interviews with 1,018 national adults, aged 18 and older, conducted Feb. 6-7, 2009, as part of Gallup Poll Daily tracking. For results based on the total sample of national adults, one can say with 95% confidence that the maximum margin of sampling error is X percentage points.” • CAN YOU CALCULATE THEIR MARGIN OF ERROR?
Confidence Intervals for Proportions • Sample point estimate (convert % to a proportion): • “39% of Americans say they ‘believe in the theory of evolution,’ while…” estimate is .39 • Formula in Babbie (p.217): P (1-P) --------- N 95% confidence level 1.96 standard errors
What happens when… • Still using 39%... • Change the sample size to 100 • Use original sample size, but change confidence level to 68% • Use the original sample size, but assume the percentage is 96% rather than 39%
Types of Probability Sampling • EPSEM • SYSTEMATIC (every Kth element) • Stratified • Cluster • Disproportionate (oversample) + weighting
Composite Measures • Why use composite (adding indicators up) as opposed to a single indicator of a concept? • Index • Typically adding yes/no (coded as 0/1) or ordinal scales (codes as 1-4) together • “Simple Summated Index” • SPSS review/demo– or, just do the assignment?