Download
1 / 44
450 likes | 906 Views
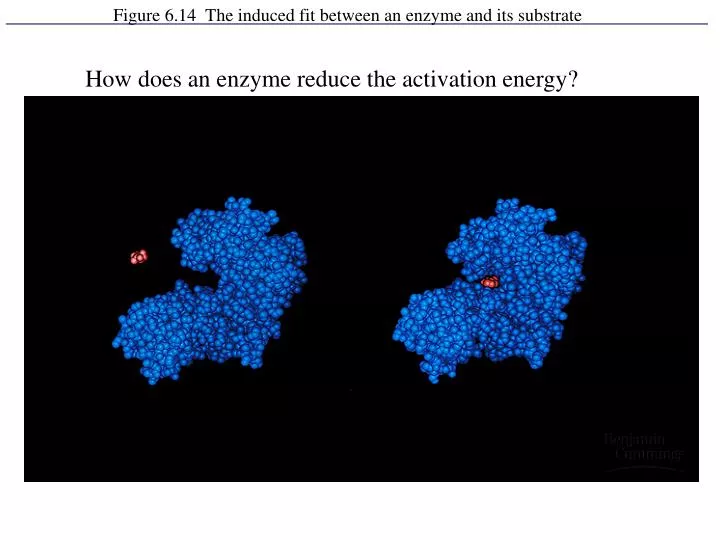
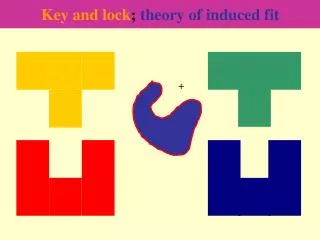
Figure 6.14 The induced fit between an enzyme and its substrate. How does an enzyme reduce the activation energy?. Figure 6.15 The catalytic cycle of an enzyme. Enzyme + Substrate ES Complex Enzyme + Product.

E N D
Figure 6.14 The induced fit between an enzyme and its substrate How does an enzyme reduce the activation energy?
Figure 6.15 The catalytic cycle of an enzyme Enzyme + Substrate ES Complex Enzyme + Product
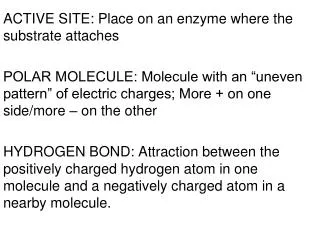
Environmental effects on enzyme activity and the regulation of enzyme activity.
Some Enzymes require Co-enzymes or Cofactors -Bound at active site, help with catalysis -Co-enzymes are organic molecules, often vitamins or dericvitives -Cofactors are metal ions like Mg++, Zn++, Fe++
Inhibition of enzyme activity “Allosteric Inhibition”
What are the metabolic pathways used to harvest energy in cells?
So what do you think of when you hear the term “Respiration”?
But why do cells need oxygen? C6H12O6 + 6O2 6CO2 + 6H2O + ENERGY (ATP)
Oxidation C6H12O6 + 6O2 6CO2 + 6H2O G = -686 kcal Reduction Oxidation/Reduction Reaction or “Redox Reaction” Oxidation: Loss of electrons (loss of H) Reduction: Gain of electrons (gain of H) Not all Redox reactions involve the complete transfer of electrons, but a change in the degree of sharing of electrons between atoms in covalent bonds. If, in a Redox reaction, electrons end up with less potential energy, then energy is released.
Electrons have less potential energy if they “fall” closer to an electronegative nucleus. Figure 9.3 Methane combustion as an energy-yielding redox reaction Much more stable electron configuration, less potential energy - energy was released.
The coenzyme NAD+ acts as an electron shuttle between dehydrogenation reactions(during the breakdown of glucose) and the transfer of H to O2 to form H2O. Figure 9.4 NAD+ as an electron shuttle Very little energy lost from electrons when transferred to NAD+
oxidation C6H12O6 + 6O2 6CO2 + 6H2O ΔG= -686 kcal reduction ATP Very little energy lost from electrons when transferred to NAD+
Figure 9.5 An introduction to electron transport chains Oxidative Phosphorylation
Figure 9.9 A closer look at glycolysis: energy investment phase (Layer 2)
Figure 9.9 A closer look at glycolysis: energy payoff phase (Layer 4)
http://www.northland.cc.mn.us/biology/Biology1111/animations/glycolysis.htmlhttp://www.northland.cc.mn.us/biology/Biology1111/animations/glycolysis.html
Kreb’s Cycle Summary (In mitochondial matrix) -Carbons of pyruvate CO2 -ATP generated by substrate level phosphorylation -More NADH (and FADH2) formed
Figure 9.10 Conversion of pyruvate to acetyl CoA, the junction between glycolysis and the Krebs cycle Matrix Outer membrane Inner membrane
Figure 9.11 A closer look at the Krebs cycle (Layer 4) http://www.youtube.com/watch?v=FgXnH087JIk
Now, how do we cash-in on the high-energy electrons of NADH and FADH2? How many have we generated from a molecule of glucose? Glycolysis: 2NADH 2Pyruvate 2Acetyl COA: 2NADH Kreb’s Cycle: 6NADH, 2FADH2
Figure 9.5 An introduction to electron transport chains Oxidative Phosphorylation
Figure 9.13 Free-energy change during electron transport Electron Transport Chain
Figure 9.15 Chemiosmosis couples the electron transport chain to ATP synthesis http://highered.mcgraw-hill.com/sites/0072437316/student_view0/chapter9/animations.html#
Each NADH results in 3 ATP Each FADH2 results in 2 ATP http://www.sp.uconn.edu/%7Eterry/images/movs/synthase.mov
So how much ATP is formed from 1 Glucose? Substrate level phosphorylation? Oxidative phosphorylation?
Figure 9.16 Review: how each molecule of glucose yields many ATP molecules during cellular respiration 28 ATP 30-32 ATP
Figure 9.20 The control of cellular respiration Phosphofructokinase: inhibited by ATP, Citrate. Activated by ADP and AMP.


![Lecture 3: Factors affecting enzyme activity: [substrate] and inhibitors](https://cdn3.slideserve.com/5730998/lecture-3-factors-affecting-enzyme-activity-substrate-and-inhibitors-dt.jpg)