Download
1 / 1
20 likes | 150 Views
A model for predicting spectral signature of suspended sediments Vijay Garg & Indrajeet Chaubey † ECOLOGICAL ENGINEERING GROUP † Respectively, Graduate Assistant, and Assistant Professor, Dept of Bio. and Agricultural Eng., University of Arkansas, Fayetteville, AR 72701.

E N D
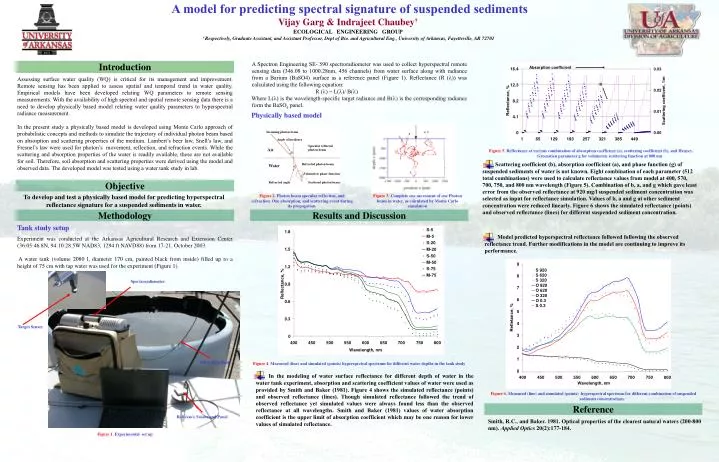
A model for predicting spectral signature of suspended sediments Vijay Garg & Indrajeet Chaubey† ECOLOGICAL ENGINEERING GROUP † Respectively, Graduate Assistant, and Assistant Professor, Dept of Bio. and Agricultural Eng., University of Arkansas, Fayetteville, AR 72701 Incoming photon beam Angle of incidence Air Specular reflected photon beam i Refracted photon beam Water Volumetric phase function r Refracted angle Scattered photon beam Spectroradiometer # # # # # # Target Sensor 550 Gallon Tank Reference Sensor and Panel A Spectron Engineering SE- 590 spectroradiometer was used to collect hyperspectral remote sensing data (346.08 to 1000.28nm, 456 channels) from water surface along with radiance from a Barium (BaSO4) surface as a reference panel (Figure 1). Reflectance (R ()) was calculated using the following equation: R () = L()/ B() Where L() is the wavelength-specific target radiance and B() is the corresponding radiance form the BaSO4 panel. Introduction Assessing surface water quality (WQ) is critical for its management and improvement. Remote sensing has been applied to assess spatial and temporal trend in water quality. Empirical models have been developed relating WQ parameters to remote sensing measurements. With the availability of high spectral and spatial remote sensing data there is a need to develop physically based model relating water quality parameters to hyperspectral radiance measurement. In the present study a physically based model is developed using Monte Carlo approach of probabilistic concepts and methods to simulate the trajectory of individual photon beam based on absorption and scattering properties of the medium. Lambert’s beer law, Snell’s law, and Fresnel’s law were used for photon’s movement, reflection, and refraction events. While the scattering and absorption properties of the water is readily available, these are not available for soil. Therefore, soil absorption and scattering properties were derived using the model and observed data. The developed model was tested using a water tank study in lab. Physically based model Specular reflection Figure 5. Reflectance at various combination of absorption coefficient (a), scattering coefficient (b), and Henyey-Greenstien parameter g for volumetric scattering function at 800 nm Scattering coefficient (b), absorption coefficient (a), and phase function (g) of suspended sediments of water is not known. Eight combination of each parameter (512 total combinations) were used to calculate reflectance values from model at 400, 570, 700, 750, and 800 nm wavelength (Figure 5). Combination of b, a, and g which gave least error from the observed reflectance at 920 mg/l suspended sediment concentration was selected as input for reflectance simulation. Values of b, a and g at other sediment concentration were reduced linearly. Figure 6 shows the simulated reflectance (points) and observed reflectance (lines) for different suspended sediment concentration. Objective To develop and test a physically based model for predicting hyperspectral reflectance signature for a suspended sediments in water. Figure 2. Photon beam specular reflection, and refraction. One absorption, and scattering event during its propagation. Figure 3. Complete one movement of one Photon beam in water, as calculated by Monte Carlo simulation Methodology Results and Discussion Tank study setup Model predicted hyperspectral reflectance followed following the observed reflectance trend. Further modifications in the model are continuing to improve its performance. Experiment was conducted at the Arkansas Agricultural Research and Extension Center (36:05:46.8N, 94:10:28.5W NAD83, 1294 ft NAVD88) from 17-21, October 2003. A water tank (volume 2080 l, diameter 170 cm, painted black from inside) filled up to a height of 75 cm with tap water was used for the experiment (Figure 1). Figure 4. Measured (line) and simulated (points) hyperspectral spectrum for different water depths in the tank study In the modeling of water surface reflectance for different depth of water in the water tank experiment, absorption and scattering coefficient values of water were used as provided by Smith and Baker (1981). Figure 4 shows the simulated reflectance (points) and observed reflectance (lines). Though simulated reflectance followed the trend of observed reflectance yet simulated values were always found less than the observed reflectance at all wavelengths. Smith and Baker (1981) values of water absorption coefficient is the upper limit of absorption coefficient which may be one reason for lower values of simulated reflectance. Figure 6. Measured (line) and simulated (points) hyperspectral spectrum for different combination of suspended sediment concentrations Reference Smith, R.C., and Baker. 1981. Optical properties of the clearest natural waters (200-800 nm). Applied Optics 20(2):177-184. Figure 1. Experimental set up