Download
1 / 36
370 likes | 503 Views
Metrics for Reporting Benefits of Commissioning in New School Facilities. Kristin Heinemeier, Ph.D., P.E. Technical Director Brooks Energy & Sustainability Lab with Balaji Santhanakrishnan, Anita Ledbetter, Michael Martin, Dean Schneider, Jim Shoop, Wes Harvey,

E N D
Metrics for Reporting Benefits of Commissioning in New School Facilities Kristin Heinemeier, Ph.D., P.E. Technical Director Brooks Energy & Sustainability Lab with Balaji Santhanakrishnan, Anita Ledbetter, Michael Martin, Dean Schneider, Jim Shoop, Wes Harvey, Joseph Martin, Frank Thomas 12th National Conference on Building Commissioning May 18, 2004
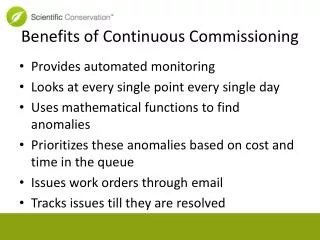
Benefits of Commissioning • Reduce Operating Costs • Energy • O&M • Better Building • Thermal comfort • Indoor air quality • Better Process for Providing Building • On time • Within budget
There is an urgent need for solid (non-anecdotal) data on the benefits of commissioning.
Case Study into Benefits for Texas Schools • Funded by State Energy Conservation Office • Investigate the Feasibility of Commissioning in New School Facilities • Emphasize Benefits • Develop a Guide for other Texas Schools
Possible Methodologies • Large Sample Size • Statistically significant sample • Expensive! • What metrics to collect? • Carefully Controlled Side-by-Side • Hard to find good comparisons • A lot of variables to control • How generalizable are results • Still need metrics for comparison
Methodology We Used • Exploratory, Not-So-Controlled Side-by-Side Study • Mixture of Qualitative and Quantitative Methods • Quantify, Estimate, Identify • Very detailed data collection
Commissioned School • Northside ISD – San Antonio • Dean Krueger Elementary School • 100,800 sqft • 800 students • ~$11,000,000 construction cost (est) • Design started 2003 • Expected Occupancy August 2005 • MEP Commissioned by TSI
Baseline School • Patricia Blattman Elementary School • 80,000 sqft (a little smaller) • 660 students (a little fewer) • ~$10,400,000 construction cost (est) (a little less) • Design started 2001 • Occupancy August 2003 • Same architect, different contractors
Baseline School: Blattman Elementary School • source: www.nisd.net
Baseline School: Blattman Elementary School • source: www.nisd.net
From an uncommissioned school we expected: Chaos Upon First Occupancy Baseline School • source: www.nisd.net
But it’s a very good school. Baseline School • source: www.nisd.net
Data Collection Methods • Interviews • School District Staff (engineering, construction, energy management, O&M) • Architect, ME, GC, Subcontractors • Construction Documents • Building Plans and Specs, Change Orders, Requests for Information, Meeting Minutes • Work Order Data • Utility Data, Interval Energy Data • Occupant Surveys and Interviews • Building Walkthru, Observations
Analysis Methods • Define Narrative of Design and Construction Processes • Modeling Baseline Building Commissioned Building Calibrated Simulation With Deficiencies Without Deficiencies Identify Deficiencies Identify Deficiencies Adjusted Simulation Without Deficiencies With Deficiencies
Analysis Methods, cont.:Define and Tabulate Metrics • Numeric • Clearly Defined, Unambiguous • Easily Collected using Simple Data Collection Methods • Normalized for Different Size Schools (sqft or construction costs) and Other Factors • Capture Benefits from Commissioning
Request for Information • Formal Communication from Contractor to Design Team • ask for clarification • comment on items that may not work as designed • suggest alternative design • Are they good or bad? • design was unclear or incorrect • healthy communication between contractor and designers • Metrics • Number of MEP-related RFIs/10,000 sqft
RFIs at Baseline School • 92 RFIs submitted • 22 related to MEP – 2.6/10,000 sqft • For MEP-related RFIs • 0-32 days in review, 9 average • Several resulted in Change Orders • Several could have been addressed in Design Stage
Change Orders • Work required by contractor differs from what was assumed during the bidding process • unforseen circumstances • change in requirements by designer or owner • response to RFI • More expensive to do work as a change order • Metrics • Number of MEP-related Cost / 10,000 sqft • Cost (as % of construction costs)
Ex: Adding Ventilation as CO • 41% of price Prepare Opening in SR Ceiling Sheet Metal Labor: Reassignment of Manpower Touch up Painted Ceiling Sheet Metal Labor: Concurrent Operations Material Handling Sheet Metal Labor: Beneficial Occupancy Clean Up Sheet Metal Labor: Site Access PM Coordination Time Coordination Estimating Time Drafting/As-Built Drawings Field Clerk Testing As-built & Shop Drawings Administrative fee
Punch List • Result of Inspection near end of construction • All items must be addressed as part of Substantial completion • Want this List as Short as Possible • EVERYBODY wants to finish project, so items may be ignored • Metrics • number of MEP-related items on punchlist/room
Schedule • Cx helps anticipate and eliminate schedule conflicts • Addressing issues earlier rather than later, in design and construction • Define Milestones: • Beginning of Design • End of Design/Beginning of Construction (est/actual) • End of Construction (est/actual) • Metrics • % Slippage (actual duration/expected duration)
Cost • Cost of Designing and Building the Facility Can be Reduced • Design Costs • Construction Costs (including all contingencies and change orders) • Metric • $/sqft • percent overrun: • bid / expected (how well design met cost expectations) • actual / bid (cost overruns during construction)
Cost at Baseline School • Difference between Expected and Actual Design Cost • -4% • Difference between Expected and Bid Construction Cost • -5% • Difference between Bid and Actual Cost • 1%
Work Orders • Cx should Reduce Number of Service Calls and Cost of Service Calls • Especially during early occupancy: problems have already been addressed • More maintainable building • Metrics • Number and Cost of MEP-related Service Calls in first year / 10,000 sqft
Occupant Identified Problems • Occupants are a good judge of significance of problems • Surveys, interviews of principal, teachers, custodian, other staff, students • Should be fewer occupant-reported problems, especially in early occupancy • Metrics • Number of Significant MEP-related Problems reported in first year • Judgement: what is significant?
Occupant Identified Problems at Baseline School • 5 Significant Problems Reported: • AC in Gymnasium didn’t work • Problems with Plumbing • Window and Door Leaks • Premature Ballast Failures • Dusty Rooms
Energy Use • Energy Use should be lower than Non-Commissioned School • Metric • Site Btu/sqft for first year - % below benchmark (CBECS regional) • Other normalization: • Weather • Computer labs, AC in Gym, pools
Energy Use • Monthly Energy Use (first 6 months) • 5.1 kBtu/sqft • 30% Above District Average • 10% Below CBECS South
Summary of Metrics • Others to consider: • callbacks, major deficiencies • thermal comfort, IAQ,
Future Work Needed • How reliable are the metrics? • How much natural variation is there? • What is the best normalization? • What is the appropriate scope (eg, MEP)? • How well do they really capture performance? • How much effort does it take to collect them? Who can collect them? • How much are they affected by judgement required?
Application of Metrics • Include these types of metrics in case-study protocols • eg, California Commissioning Collaborative • Large statistically-significant data collection efforts (combined efforts? BCA?) • Compared to what? • Need research on current practices in building construction and metrics for performance of conventional buildings
Thank you! Questions? • source: www.nisd.net