Download
1 / 23
230 likes | 305 Views
PISA 2012. Canadian Results. PISA 2012 by the numbers. 65 countries and economies. Over 480,000 15-year-old students. 34 OECD countries. 47 languages. PISA 2012 in Canada. Partnership between CMEC,ESDC and STC. Over 21,000 15-year-old students from over 900 schools.

E N D
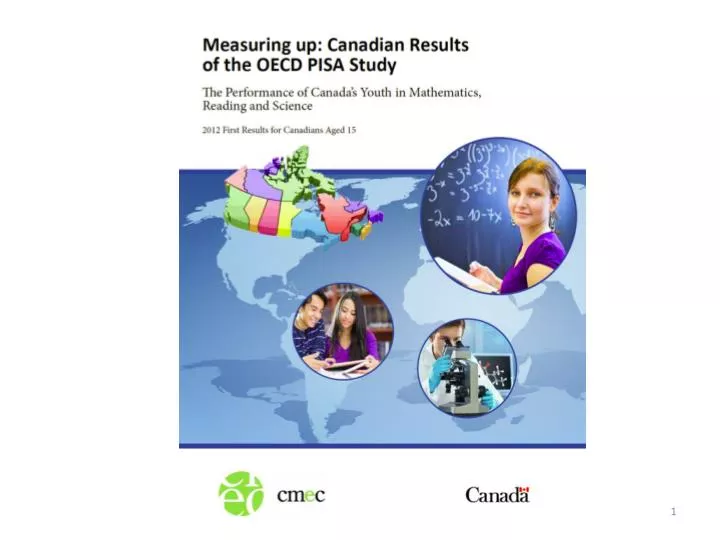
PISA 2012 Canadian Results
PISA 2012 by the numbers 65 countries and economies Over 480,000 15-year-old students 34 OECD countries 47 languages
PISA 2012 in Canada Partnership between CMEC,ESDC and STC Over 21,000 15-year-old students from over 900 schools Administered in English and French 10 provinces
Whatis in a PISA test? For a subset of students For all students 1-hour computer-based test 2-hour paper-based test Major Domain: Mathematics Additional Domains: Mathematics Digital reading Problem solving Minor Domains: Reading Science 30-minute Background Questionnaire
Canadian students continue to performwell in a global context. Italics = OECD country
Canadian students continue to performwell in a global context. Italics = OECD country
In Canada, there are variations between provinces in mathematics. Above Canadian average Quebec At the Canadian average British Columbia Alberta Ontario Below the Canadian average Saskatchewan Manitoba New Brunswick Nova Scotia Prince Edward Island Newfoundland and Labrador
Canadian students continue to perform well in reading ... Italics = OECD country
Canadian students continue to perform well in reading ... Italics = OECD country
… and in science. Italics = OECD country
… and in science. Italics = OECD country
Nine countries achieved higher results than Canada in mathematics, five in reading, and seven in science.
Over 85% of Canadian studentsreached the baselineLevel 2 or above in mathematics… Distribution of students by proficiency level on the overall mathematics scale, Canada, provinces, and OECD
… while over 16% of Canadian studentsreached the highestlevels of performance. Distribution of students by proficiency level on the overall mathematics scale, Canada, provinces, and OECD
In Canada, the proportion of low achievers has increased over time, while the proportion of high achievers has decreased.
Over the pastnineyears, Canadian scores in mathematics have declined in all provinces exceptQuebec and Saskatchewan…
… whileCanada’soverall performance in reading has remained stable over time, and performance in science has decreased. Canadian results over time, 2000–2012 Reading and Science
Canadian results in mathematics are characterized by relatively high levels of achievement and equity.
Provincial results in mathematics are also characterized by relatively high levels of achievement and equity.
Across Canada, mathematics results show some differences by language of the school system.
There are large differences in reading and science achievement by language of the school system in most provinces.
Males perform better than females in mathematics … … but the gender gap in reading in favour of femalesislarger and persistent, whilethereis no significantdifference in science. 10 points 17 points 35 points 21 points 3 points