Download
1 / 28
280 likes | 437 Views
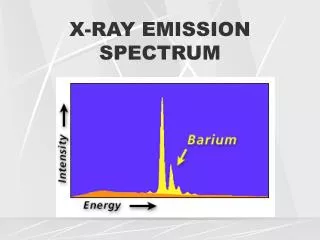
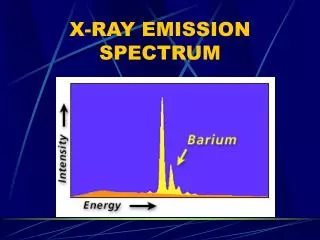
3. PROTON INDUCED X-RAY EMISSION Theory and Procedure of Spectrum Analysis. PIXE BASICS.

E N D
3. PROTON INDUCED X-RAY EMISSION Theory and Procedure of Spectrum Analysis
PIXE BASICS • For an incident proton energy of 1 – 4 MeV, elements with atomic numbers up to about 50 are generally determined through their K X-rays (typically Ka line). Heavier elements are measured through their L X-rays because the energies of their K X-rays are too high to be detected by using the Si(Li) detector available commercially. • The concentration of an element is deduced from the intensity of the measured X-ray line together with parameters obtained either theoretically and/or experimentally.
Consider a specimen which is so thin that the energy lost, dE, by a traversing proton of a few MeV (range of tens of microns) is negligible. X-rays are measured using a Si(Li) detector with an experimental arrangement as shown in the following diagram: Si(Li) X-ray Target X-ray protons E = Eo – dE (dE << Eo ) Eo X-ray X-ray QUANTIFICATION FOR THIN SPECIMENS
The number of counts under the X-ray peak corresponding to the principal characteristic X-ray line of an element is called the yield (Yu ) for the u - line. It is a product of 5 quantities: Yu = • Np• nz•su•eu 4 The X-ray yield Where = solid angle subtended by the detector at the target, Np = number of incident protons that hit the specimen, nz = number of sample atoms per unit area of the specimen, z is the atomic number of the element, su = production cross-section for u - line x-rays, eu = detection efficiency for u - line x-rays.
This quantity (denoted by mz ) is related to nz (the number of element atoms per unit area) by the equation: Az• nz mz = No where Az = atomic mass of the sample element, No = Avogadro’s number (6.02252 x 10²³). Areal concentration of an analysed element The concentrations of the analysed elements are usually what one wants to obtain from a PIXE measurement. For thin specimens, the areal concentration (i.e. mass/unit area) is often the quantity of interest .
DETERMINATION OF Np The knowledge on the number of protons that hit the specimen in a PIXE measurement is required for quantitative PIXE analysis. Np can be measured directly or indirectly. As protons are positively charged, Np is often measured by charge integration and quoted in units of micro-Coulombs (or mC). The charge carried by a proton is 1.60210 x 10⁻¹⁹ Coulombs. The charge carried by Np protons is therefore: Qp = 1.60210 x 10⁻¹³ x Np mC
Direct Np determination methods • Use of a Faraday cup coupled to a charge integrator. Charge integrator This is only suitable when the specimen is not thick enough to stop the proton beam. For thick and conducting specimen, one may couple the charge integrator directly to the specimen holder. Proton beam Faraday cup Specimen These methods involve charge integration carried out in various ways.
Direct Np determination methods (cont.) Proton beam Beam chopper Specimen Charge integrator • Use of rotating vane or chopper which periodically intercepts and samples the proton beam.
Indirect Np determination methods A common method is by measuring the back-scattered protons from the specimen. Proton beam Specimen Particle detector One may obtain Np by measuring the number of protons back-scattered from a thin film (carbon is often used). Thin carbon film Proton beam Specimen Particle detector
su is a product of three factors: su = sS•wS•ru where sS = S-shell ionization cross section (S = K, L, M, …), wS = fluorescence yield, ru = fractional radiative width of u-line X-rays. X-ray production cross-section su
Area = ss nz = 7 cm-2 1 cm 1 cm The ionization cross-section sS sS is a probability factor and has the dimensions of area. The product nz•ssrepresents the probability for a proton to knock off a s-shell electron from a target atom.
Determination of sS sS is a function of incident proton energy and can be determined theoretically. Three different theoretical approaches have been used to calculate the cross sections for inner-shell vacancy creation: • the binary encounter approximation(BEA), • the semi-classical approximation (SCA), • the plane wave Born approximation (PWBA). Theoretical cross sections for K-shell ionization with protons calculated with PWBA are found to be in good agreement experimental data and are adequate for most PIXE work. For the case of L-shell ionization, the situation is much less favorable.
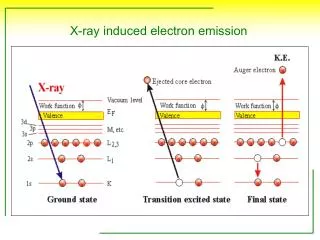
The fluorescence yield Following the ejection of an electron from an inner atomic shell through the ionization process, the vacancy in this particular atomic shell is quickly filled by an electron from an outer shell. Such an electron transition will lead to the emission of either a characteristic X-ray or an Auger electron. The probability of the X-ray emission alternative is known as the fluorescence yield. Although the fluorescence yield can be calculated theoretically, experimental data are usually used in PIXE analysis.
The K shell of an atom is a single shell and has no sub-shell. Therefore K-shell fluorescence yield of an atom is simply: where Ik is the total number of K x-rays emitted from a sample and Nk is the number of K shell vacancies. Ik Nk wk = The k-shell fluorescence yield
An electron from an outer shell may occupy a vacancy in any of the 3 L sub-shells. III II I L Coster Kronig transitions The L-shell fluorescence yield The definition of fluorescence yield for the L shell (or any higher shell) is more complicated because of the Coster Kronig transition (non-radiative transition between sub-shells). The L shell has 3 sub-shells (LI, LII and LIII), and Coster Kronig transitions can occur between LI and LII, between LI and LIII, or between LII and LIII. A Coster Kronig transition will result in shifting a vacancy from a lower-energy sub-shell to a higher-energy sub-shell.
The fractional radiative width ru Electron transitions in the atomic de-excitation are governed by the following “selection rules”: n 1 l = ±1 j = ±1 or 0 Where n, l and j are the principle, the orbital angular momentum and the total angular momentum quantum numbers respectively. Although “forbidden transitions” are observed but their probabilities are usually very small and not of any significant. The electron that fills up the vacancy in a particular inner shell may come from one of the many outer shells allowed by the selection rules, but with different probabilities which are often referred to as fractional radiative widths.
VII | I V | I III II I N M L K b2 a1 a2 b3 b1 K X-ray lines The K X-ray lines come from electron transitions that finish at the K shell. The partial energy level diagram below shows the origin of the main K X-ray lines: By convention, an X-ray line is denoted by a leading capital letter indicating the final shell involved in the transition followed by a small Greek letter and a numeric subscript to reflect the intensityof the line relative to the others (for example Ka1). a1 is the strongest line, a2 the next and followed by b1 etc. In x-ray spectra obtained using Si(Li) detectors, the a sub-lines and the b sub-lines usually appear as two lines because the energies of the sub-lines are too close to be resolved. Hence, these two lines are often referred to simply as Ka line and Kb line.
The L X-ray lines come from electron transitions that finishon the L shell. The partial energy level diagram below shows the origin of the principle L X-ray lines: VII | I V | I III II I N M L a1 a2 g1 b2 b3 b4 b1 L X-ray lines
Detection efficiency e The detection efficiency of a Si(Li) X-ray detector is dependent on the X-ray energy. It is usually determined theoretically using the parameters (i.e. thicknesses of Si diode, Be window, gold contact and Si dead layer) provided by the detector manufacturer. However, calibration standards (targets containing one or more elements of known concentrations) are often used to determined e experimentally.
The expression for Yu introduced earlier can be written as: Yu = • Qp• mz•eu•yu No •u 4 • (1.60210 x 10⁻¹³) • Az yu = where RELATION BETWEEN X-RAY YIELD AND AREAL CONCENTRATION
By re-arranging the equation in the previous slide , we have the following formula which can be used to determine the areal concentration of an element in a thin specimen. Yu • Qp• eu •yu mz = FORMULA FOR DETERMINING AREAL CONCENTRATION Note that yu can be computed theoretically and is the yield per mC of charge per unit areal concentration per steradian for 100% detection efficiency.
Yu • Qp• eu •yu •fT cz = Use of filters In PIXE measurements of intermediate and thick specimens, the bremsstrahlung background can be large, especially in the low-energy region. This will bring about poorer detection limits for the detection of light elements as well as diminish the sensitivity for the detection of medium- and high-z elements. To reduce the low-energy background, a plastic or metal filter of appropriate thickness are often placed between the specimen and the detector. If a filter is used, one must correct for its effect of x-ray attenuation in calculating the concentration of an element. Thus the equation for cz becomes: where fT is the transmission factor of the filter, which is a function of X-ray energy.
as can been seen from the spectrum shown below, which is obtained from a lung tissue taken from a patient suffered from hard metal lung disease: X-ray counts X-ray energy (kev) A PIXE spectrum consists of two components: peaks due to characteristic X-rays, & a background continuum,
Secondary electron bremsstrahlung (SEB) • When an incident proton is traversing a target, it ionizes atoms along its path, ejecting electrons from the atomic shells and losing some energy in each encounter. The slowing down of the ejected electrons through their interaction with the nuclei in the target results in the emission of the so-called secondary electron bremsstrahlung, which is the major component of the continuous background below the maximum energy that can be transferred from an incident proton to an atomic electron. Maximum energy transfer occurs when a proton collides head-on with an electron and can be calculated using the following equation: • Ee(max)= Ep • where m is the mass of electron, M the mass of proton and Ep the incident proton energy. Since m/M 1/1836, SEB is the dominant background below ~0.0022Ep. SEB is very intense in the low-energy region and decreases rapidly with energy. 4m M SOURCES OF BACKGROUND
ds dE • Proton bremsstrahlung • When the incident protons are being slowed down in the target through the coulomb interaction with the nuclei, they also produce bremsstrahlung. The proton bremsstrahlung background is insignificant in the energy region where SEB dominates, and also decreases with energy. The following diagram shows a sketch of the bremsstrahlung spectrum produced from bombarding a thin polycarbonate film with 2 MeV protons. 1000 100 10 1 Total SEB p-bremsstrahlung 0 2 4 6 8 10 12 X-ray Energy (keV)
3. g-ray background With an incident proton energy in the range 2 – 4 MeV, g-rays may be produced by nuclear reactions such as (p, g), (p, p’g) and (p, ag). This background is not predictable in the sense that bremsstrahlung is, since it depends on the particular elements present in the specimen and on the cross-sections of the reactions induced. The g-rays interact almost entirely by Compton scattering in the Si(Li), leaving behind a spectrum of electron energies which constitutes an intense and rather slowly varying background. Fluorine has a very high g-ray yield from the reaction 19F(p, p’g)19F. The diagram in the next slide shows the sketch of the PIXE spectrum obtained from a blank Teflon (CF2) thin film.
PIXE spectrum obtained from irradiating a Teflon film with 2 MeV protons 1000 100 10 1 Total SEB COUNTS g-rays p-bremsstrahlung 0 2 4 6 8 10 12 X-ray Energy (keV)
DETECTION LIMITS The detection limits for the various elements in PIXE are determined by the sensitivity factors on one hand, and on the other hand by the spectral background intensity where the element signal is expected. It is now a general practice to define the detection limit, DLz for an element Z as the amount of the element that gives rise to a net peak intensity equal to 3 times the standard deviation of the background intensity, NB, in the spectral interval of the principal X-ray line, i.e. DLz = 3 std. dev. (NB) 3 (NB)½