Download
1 / 55
550 likes | 633 Views
Control Phase GB Module #11. Continuous Improvement Road Map. Define. Improve. Define CTQ Determine Current State. Verify Effects of Key inputs with DOE’s Determine Optimum Settings. Analyze. Evaluate Existing Control Plan Using statistical methods to determine potential key inputs

E N D
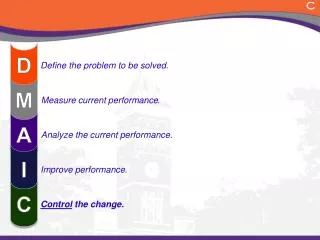
Continuous Improvement Road Map Define Improve • Define CTQ • Determine Current State • Verify Effects of Key inputs with DOE’s • Determine Optimum Settings Analyze • Evaluate Existing Control Plan • Using statistical methods to • determine potential key inputs • Prioritize key input variables Measure • Determine Key Input / Output Variables • Perform MSA • Calculate initial process capabilities Control • Update Control Plan • Verify Improvements N
Control Phase • To ensure that any gains are sustained for the long term • To ensure lessons learned are transferred across the business
X1 X2 X3 Z1 Z2 Z3 Control • Implement long-term control methods Controllable Inputs Quality Characteristics: Outputs LSL USL Inputs: Raw Materials, components, etc. Y1, Y2, etc. The Process Uncontrollable Inputs
Learning Objectives • How to move project from improvement to daily work routines • Tools to assure process remains in Control • Responsibility for project after the transition into the Control Phase (Who Is Responsible?) • As project leader, when am I done?
Why do we Care? Transitioning your project into daily work is important to you because; • It assures the gains will continue after you move on • When the transition takes place, you are free to move on • The improvement you have made will continue to benefit all of us • It feels good to finally solve a problem or improve a process
Keys to Success • Early involvement of all work cell/department members • Update all affected parties (including Supervisors/Mgrs regularly) • Get Buy-in. No surprises! • Poke Yoke the process • Establish frequent measurement of inputs • Establish procedures for the new / updated process • Train everyone. Assign responsibilities • Monitor the results
Sustaining the Gain How do we maintain the gains we have achieved during the Improvement Phase? Sustaining our Let’s discuss some ideas… Gains
Changes must be permanent • Changes must be built into daily routine • Measurements must be established for monitoring • Responsibilities must be clear and accepted • Develop / Update procedures • Train all involved • Action Plan agreed • Sustaining the Gain
Sustaining the Gain • Product changes • Revise drawings • Work with Process, Test and Product Engineers • Process changes • Physically change the process flow (5S the project area) • Develop visual indicators (Visual Factory) • Establish / buy new equipment to aid assembly / test • Poke-Yoke wherever possible including forms / worksheets
Sustaining the Gain • Procedures (Standardized Work Instructions) • Develop new procedures or revise existing ones • Notify Quality Assurance (QA) of new procedure to incorporate into internal audits • Provide QA a copy of standardized work instructions
Sustaining the Gain • Measurements (Visual Indicators) • Posting of key metric updates built into the process • Make it part of someone’s regular job to do timely • Make it someone’s job to review the metric and take action when needed • Training • Train everyone regarding the new process (Do not leave until there is complete understanding)
Monitoring the Process Purpose • To ensure the improved process is stable and meeting the expected performance levels • To demonstrate that the predicted benefits are being achieved. Deliverables • A plan to detail the control actions for the process. • The actual measurements taken over a suitable period of time that show it is under control and meeting expectations.
Aspects of Control Operational Method Sheets (OMS) Poke - Yoke (Mistake Proofing) Written Instructions Verbal Instructions DFSS SPC AMOUNT OF CONTROL Amount of Effort Expended by the Process Employ the Control Technique that ensures the Greatest Control with the Least Amount of On-Going Effort from the Process
Control Methods • SPC on X’s or Y’s without proper training = WALL PAPER • S.I.P is implemented to attempt to detect defects. This action if not sustained in the long-term via regular audits and will fail. • The operators have been trained and understand the rules of SPC, but management will not empower them to stop or investigate. Worst Case Scenarios
Control Methods Worst • Inspection: Implementation of a short-term containment action which is likely to detect the defect caused by the error condition. Containments are typically audits or 100% inspection. • SPC on X’s or Y’s with fully trained operators and staff who respect the rules. Once a chart signals a problem everyone understands the rules of SPC and agrees to shut down for special cause identification and elimination. • Countermeasure: Improvement made to the process which will eliminate the error condition from occurring. The defect will never be created. This is also referred to as a long-term corrective action in the form of mistake proofing or design changes Best
Importance to Customer (Why) The only reason a control plan exists is to ensure that we consistently operate our processes such that product meets customer requirements ALL THE TIME! CustomerRequirements Product/PartCharacteristics ProcessCharacteristics ProcessControl ProductionControlPlan
Control Plans • What elements make up a control plan • Why should we bother with them • Who contributes to their preparation • How do we develop one • When do we update them • Where should the plan reside High risk areas only!
Collect existing OE documentation for process Determine scope of process for current control plan Form teams to update documentation more than one quarter old Short term capability studies should be replaced with long term capability results Fill in Control Plan Summary (CtrlPlan.doc) based on review of updated OE documentation Identify missing or inadequate components — gaps Pay particular attention to adequacy of training, maintenance, operating and reaction plans Assign tasks to team members to complete missing plan elements Verify compliance with plant documentation requirements (Re)train operations and maintenance personnel Collect sign-off signatures from safety & environmental, maintenance, operations and process engineering Verify control plan effectiveness in six months with long term capability study Control Plan Roadmap
Cause and Effects Matrix PAPERWORK TURN STEAM ON TO DICY TANK LOAD DMF LOAD DICY LOAD 2MI 1 BILL OF MATERIALS ISO PROCEDURES REWORK SCALE ACCURACY PREHEATING LOAD ACCURACY CLEANLINESS RAW MATERIAL LOAD ACCURACY ENVIRONMENT (HUMIDITY) RAW MATERIAL MIXER SPEED LOAD ACCURACY ENVIRONMENT (HUMIDITY) RAW MATERIAL MIXER SPEED OUTPUTS INPUTS Process Map Control Plan Summary FMEA Capability Summary Key Inputs are explored & prioritized The Key Inputs are evaluated for control The Key Outputs are listed and evaluated. Tie to back to Measure Strategy
Ford Control Plan Product: Core Team: Date (Orig): Key Contact: Phone: Date (Rev): Current Control Plan Process Current Cpk / Date Measurement %R&R Sample Sample Reaction Process Process Step Input Output Specification (LSL, Control (Sample Size) System or %P/T Size Frequency Plan USL, Target) Method OE Control Plan Summary CONTPLAN.DOC
Control Plan Strategy • Operate our processes consistently on target with minimum variation. • Minimize process tampering (over-adjustment). • Assure that the process improvements that have been identified and implemented become institutionalized. ISO 9000 can assist here. • Provide for adequate training in all procedures • Include required maintenance schedules. The intent of an effective control plan strategy is to: Revise Quarterly
Factors Impacting a Good Control Plan These need to be Measurement Preliminary updated before System Analysis proceeding Measurement Process System Analysis Maps Short Term %R&R, %P/T Capability Calibration C&E Requirements Matrix Initial Control Plan Assessment Sampling & FMEA Testing Plans Customer Requirements Control Plan Long Term Maintenance Capability SPC Plans Schedules Trouble Noise Variable Shooting Compensation Operating Training Aids Windows Materials Reaction Plans DOE's SOP's Might already have some of these Improvement Procedures Activities
Control Plan Components What? • Process map steps • Key process output variables, targets & specs • Key and critical process input variables with appropriate working tolerances and control limits • Important noise variables (uncontrollable inputs) • Short and long term capability analysis results • Designated control methods, tools and systems • SPC • Automated process control • Checklists • Mistake proofing systems • Standard Operating Procedures • Workmanship Standards • Sampling & Testing • Meas. Sys. Analysis • Training Materials • Maintenance schedules • Reaction Plan and Procedures
Documenting the Control Plan • For Key Process Input and Key Process Output Variables (KPIVs & KPOVs) the measurement system and measurement system capability should be identified. • Targets and specification limits for Key Process Input Variables and Key Process Output Variables are recorded. • For continuous inputs and outputs, the Cp/Cpk indexes should be calculated. Record short & long term data where available. • The specifics of the sampling plan with associated reaction plan for out-of-spec conditions should be listed. • This document is an extension of the Current Controls column of the FMEA.
FMEA Versus Control Plan The FMEA should be a primary source for the identification of key variables to control and for an initial evaluation of current control plan
Control Plan Development Key Steps How? • Identify Key Output Variables and specifications, based on customer requirements (QFD process) • Cause & Effect Matrix • FMEA • Determine Key/Critical Input Variables • Process Map • Cause & Effect Matrix • FMEA • Multi-Vari studies • DOE • For each Key/Critical Input Variable determine: • appropriate measurement systems • relationship to output variables
Control Plan Exercise • As a team exercise, choose a process all are familiar with and complete a control plan “gap analysis” for that process or a portion of it. • Deliverable is a chart showing essential components, whether satisfactorily complete, and action to resolve missing or unsatisfactory components.
Control Plan Development Operating Windows • Continuous variables: determine optimal operating window (specifications) • Discrete/attribute variables: determine optimal setting, procedure, material, etc. • Uncontrollable noise variables: determine acceptable operating windows for compensating variables Robust Process and Product Design should be employed to reduce the impact from noise variables
Optimal Operating Windows • Targets and limits for key process input variables determined from relationships with product (response) output variables • planned experimental optimization studies such as Response Surface Methods (RSM) or Evolutionary Operations (EVOP) • fundamental, verified (calibrated) engineering models Response optimum may not be manufacturability optimum!
Optimal Operating Windows “Realistic Tolerancing” • Once we know the underlying relationship between our response variable and a given input variable, it’s relatively simple to determine the optimal operating window. • The following slides lead us through an example of setting tolerances for a Laminates treating process • Consistent b-stage cure is a critical product characteristic (response) for ensuring customer satisfaction • Web speed is an input variable which influences % Cure • We want to determine the optimal setting and spec limits for Web speed to ensure 30% Cure ± 3%
Operating Window Example % Cure and Web Speed Design of Experiments Results Note: Fabricated Data
Target % Cure Distribution (Center on Target Value) Operating Window Example Continued
Target Determine Input Target Web Speed Operating Window Example Continued
Add % Cure Spec limits Upper Spec Limit Lower Spec Limit Operating Window Example Continued Target
2 5 3 0 3 5 3 5 3 0 2 5 Determine “Realistic Tolerance” for Web Speed W e b S p e e d , f p m Upper Spec Limit e r u C % Lower Spec Limit Operating Window Example Continued LSL Target USL
2 5 3 0 3 5 3 5 3 0 2 5 Running to Target and In Control W e b S p e e d , f p m Upper Spec Limit Operating Window e r u C % Lower Spec Limit LCL UCL Realistic Tolerance Operating Window Example Continued LSL Target USL
Control Plan Development Control Methods For continuous / discrete variables: • Inspection and Test Methods • Standard Operating Procedures (“SOPs”), Checklists • Mistake-proofing systems and devices • Color tags • Single use devices • Statistical Process Control • Choice of control chart(s) and sampling plan • Procedures for identifying and responding to out-of-control points and undesirable trends • Procedures for preventing recurrence of special causes • Automated process control Better
Control Plan Development Control Methods (Cont’d) • For noise (uncontrollable input) variables: • Compensate with changes to Xs (based on known relationships, not tweaking or opinion!) • Define shutdown conditions • Use alternative quality control procedures (inspection, sorting, rework, etc.)
Control Methods Finale • Changes in the process require changes to the control method • Control methods identify person responsible for control of each critical variable and details about how to react to out-of-control conditions (see next slide) • Control methods include a training plan and process auditing system, e.g. ISO 9000 • Complicated methods can be referenced by document number and location
Reaction Plan and Procedures • Actions should be the responsibility of people closest to the process • The reaction plan can simply refer to a SOP and identify the person responsible for the reaction procedure • In all cases, suspect or nonconforming product must be clearly identified and quarantined • Can be built from the FMEA
Tennessee Eastman Experience Tennessee Eastman Corporation established a control plan methodology using Statistical Process Control (SPC) on critical process parameters that contributed to their winning the Malcolm Baldridge National Quality Award. Winners are required to share their quality systems knowledge with others. Eastman’s experience in using SPC for controlling process variables led to identification of three basic types of control actions which may be applied. Which of the control types on the next slide do we use, if any at all?
Control Action Types Improved Approaches Typically, unsuccessful control programs utilize only compensating actions. Tennessee Eastman focused their control plan implementation on preventive action. Examples include root cause analysis, operator training, preventative maintenance, controller tuning and replacing defective equipment.
How to take Preventive Action When an undocumented out-of-control condition occurs, a cross-functional team consisting mainly of plant operators, process engineers, and production supervision identifies the variable to be controlled and follows these steps: 1. Prepare or update a process flow diagram of the system. 2. A cause/effect (fishbone) diagram is prepared illustrating possible causes of variation in the process. Four basic areas to center on are: manpower, materials, methods, and machinery. 3. The team selects the most likely causes from the list. 4. Starting with the most likely causes, root causes of the variation are identified. Ask “WHY?” five times! Find Root Causes, not Likely Causes!
Root Cause Analysis Root Cause Why? Likely Cause Why? Likely Cause Why? Why? For each cause Root Cause Out of Control Why? Likely Cause Why? “Peeling the Onion” Likely Cause Why? Root Cause
Taking Preventive Action Cont’d • 5. Prepare a Reaction Plan for each out-of-control condition. • Causes are placed in the order that they should be checked, the most likely or easiest to check first. • The team determines compensating actions to take should no cause be identified. • 6. The Reaction Plan is reviewed by the team and the technical department for modifications. The team determines how the plan will be documented and how to train the work force. • 7. Corrective action (permanent ones!) assignments are made and followed up to prevent recurrence! • 8. Define a plan to collect data on how often the reaction plan is used and how well it works. Review results quarterly.
Trouble Shooting • A control plan is a logical, systematic approach for finding and correcting root causes of out-of-control conditions, and will be a valuable tool for process improvement. • A key advantage of the reaction plan form is its use as a troubleshooting guide for operators. A systematic guide of what to look for during upset conditions is valuable on its own.
Questions for Control Plan Evaluation • Key Process Input Variables (Xs): • How are they monitored? • How often are they verified? • Are optimum target values and specifications known? • How much variation is there around the target value? • What causes the variation in the X? • How often is the X out of control? • Which Xs should have control charts? • Uncontrollable (Noise) Inputs • What are they? • Are they impossible or impractical to control? • Do we know how to compensate for changes in them? • How robust is the system to Noise?