Download
1 / 19
190 likes | 297 Views
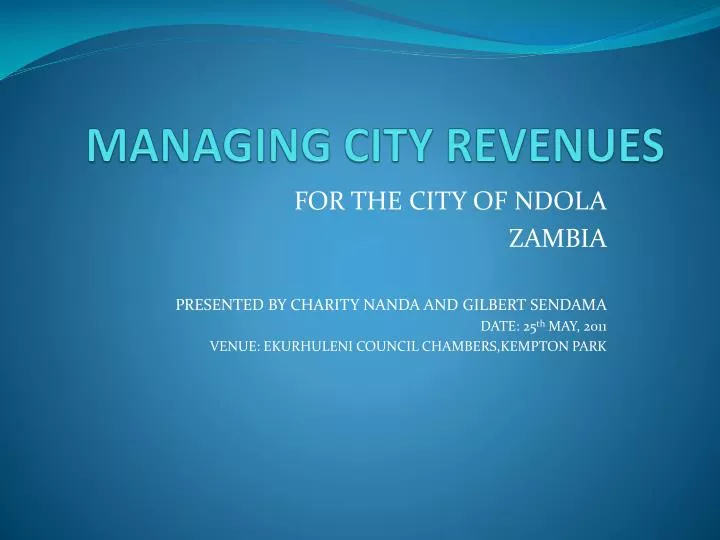
MANAGING CITY REVENUES. FOR THE CITY OF NDOLA ZAMBIA PRESENTED BY CHARITY NANDA AND GILBERT SENDAMA DATE: 25 th MAY, 2011 VENUE: EKURHULENI COUNCIL CHAMBERS,KEMPTON PARK. INTRODUCTION 1.0 GENERAL OVERVIEW AND HISTORICAL BACKGROUND. Physical Characteristics Location Topography Climate

E N D
MANAGING CITY REVENUES FOR THE CITY OF NDOLA ZAMBIA PRESENTED BY CHARITY NANDA AND GILBERT SENDAMA DATE: 25th MAY, 2011 VENUE: EKURHULENI COUNCIL CHAMBERS,KEMPTON PARK
INTRODUCTION1.0 GENERAL OVERVIEW AND HISTORICAL BACKGROUND • Physical Characteristics • Location • Topography • Climate • Challenges in managing City revenues • Main sources of Finances for City Infrastructure
1.0 GENERAL OVERVIEW AND HISTORICAL BACKGROUND • Ndola the third largest city in Zambia • total area of 110, 300 hectares • population of about 374,757(2000 National census report). • The city began as a slave trading post during the slave trade era, became a Village Management Board in 1920, a Municipality in 1932 • declared as a City in 1967, three years after the country attained its independence from the British in the year 1964
HISTORICAL BACKGROUND • 1960s -70s Ndola became important commercial, industrial and distributive center owing to booming copper mining era and the city’s strategic location. • 1990s the city experienced a period of economic decline due to liberalized economy • privatization of national companies and loss of jobs. • In recent years the city has seen economic activities and infrastructure developments resulting in demand for various services including Roads and other public facilities
Physical Characteristics Location • The City of Ndola is the Headquarters of the Copperbelt Province of Zambia • lies between latitudes 120 and 160 South of the Equator and between 250 and 300 east. • The Copperbelt Province has nine districts namely, Chililabombwe, Mufulira, Chingola, Kalulushi, , Luanshya, Mpongwe, Lufwanyama and Masaiti districts and the City of Kitwe
Physical Characteristics Location • The city of Ndola shares administrative boundaries with three towns namely Masaiti, Luanshya and Kitwe • International boundary with the Democratic Republic of Congo (DRC) to the north of Zambia
Topography • Ndola lies at altitudes ranging from 1250 to 1455m and an average elevation of 1200 m above sea level and falls within the gently sloping Copperbelt regional peneplain characterized by undulating terrain • isolated high outcrops at Dola, Nakaputa and Kaloko hills.
Rivers • The City is dissected by four main tributaries namely the Mwambashi, Muliashi, Kafubu and Luansobe Rivers which are the principle drainage lines into the Kafue River
Climate Ndola has three distinct seasons typical of the savannah climate • warm rainy average annual rainfall of 400mm influenced by the topography and prevailing winds from the Congo (November to April) • cool dry season (May to August) • hot season (September to October).
mean annual temperature 20°c and 25ºc (absolute maximum temperatures of 32 degrees in January and the absolute minimum temperature of 12 degrees in June and July. ) • The mean humidity rate is at 81% with the highest in January averaging 96% in the early morning and 66% in the early afternoons. • predominant direction of prevailing winds is 00 to 29 east of north at an average speed of 4.5 km per hour.
CHALLENGES IN MANAGING OF CITY REVENUES FOR FINANCING OF PUBLIC INFRASTRUCTURE Population distribution and its effect on urban infrastructure situation • Number of households in the City 71,053 • 23,185 in Central part of the city with 112,129 inhabitants (higher rate payers). • The combined total population for all the low income areas is approx 226,000 inhabitants depend on dilapidated infrastructure and unwilling to pay Municipal taxes.
Other challenges • · Political interference • · Preferential/Low government funding for capital projects • · Vandalism of infrastructure • · Poor response to Public Private Partnership funding • · High cost of borrowing from commercial Banks • · Government Restriction on direct external borrowing • · Poor corporate social (responsibility)participation • · Government restrictions on local tax collections
POSITIVE INDICATORS • · New investment in mining related and other developments • · Donor funded projects • · Council policy on procurement of plant and Equipment • · Effective use of Ward and Constituency Development Funds • · Strategic planning • · Integrity committees, code of Ethics ,service charters • · Good Governance • · Timely salaries and motivation of workers
MAIN SOURCES OF FINANCES FOR CITY INFRASTRUCTURE (DISTRICT FUND) • LOCAL TAXES: Residential, Industrial Commercial, Mining/plant personal levy • FEES AND CHARGES: eg market, fees, Billboards, telecommunication masts • LICENCES:Manufacture, retail, firearms etc • PERMITS: Business Permits, Nursery School Permits, Fire certification • LAND FEES: Does not include services charge. • OTHER INCOME: Dividends on shares etc
MAIN SOURCES OF FINANCES FOR CITY INFRASTRUCTURE • GOVERNMENT GRANTS: Restructuring grant, capital grant, grant in lieu of rates • 2011 TOTAL BUDGET ZMK 38.8 BILLION • INFRASTRUCTURE • GOVERNMENT POLICY IS 40 % OF TOTAL ANNUAL BUDGET to be spent on services delivery (mainly Infrastructure rehabilitation)
SERVICE PROVISION • · Maintenance of public infrastructure • · Maintenance of plant equipment, motor vehicles • · Roads and drainage maintenance • · Bush clearing and Grass cutting • Street lighting, traffic lights • · Sport recreation facilities • · Public libraries and Training Centres • · Community Development expenses • · Labour cost towards services delivery
SERVICE PROVISION • Hire of casual (wages) • · Health campaign programmes • · Ward Development fund • · Fixed Assets/ plant and equipment
CONCLUSION • It is envisaged that measures to be undertaken in the short term period and medium term will be successfully implemented within the next 12 months and 24 months respectively. • This is due to prudence in managing of the City Revenues and the necessity for continuity of programmes (highlighted major projects in the 2011-2015 STRATEGIC plan).
SIABONGA Thank You Very Much