Download
1 / 11
110 likes | 213 Views
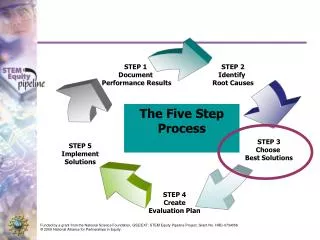
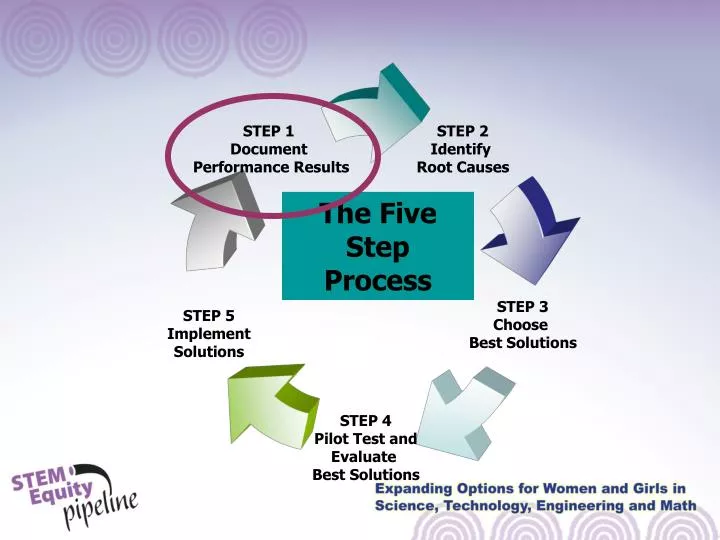
Document Performance Results. Understand the problem completely before you seek solutions How do you analyze performance data? What questions should be addressed? What tools and methods can be used to present and analyze data? How should data quality problems be considered in analyzing data?.

E N D
Document Performance Results Understand the problem completely before you seek solutions • How do you analyze performance data? • What questions should be addressed? • What tools and methods can be used to present and analyze data? • How should data quality problems be considered in analyzing data?
Defining STEM • US Dept. of Ed., Office of Vocational and Adult Education • STEM Transitions Project • www.stemtransitions.org • Gender-segregated: Less than 20% (USDOE, Office of Civil Rights) • Nontraditional: Less than or equal to 25% (Perkins)
Nontraditional Fields Occupations or fields of work, including careers in computer science, technology, and other current and emerging high skill occupations, for which individuals from one gender comprise less than 25 percent of the individuals employed in each such occupation or field of work.
National Data Sources:K-16 Academic Data • AAUW, Where the Girls Are: http://www.aauw.org/research/upload/whereGirlsAre.pdf • Girls’ successes don’t come at boys’ expense • On average, girls’ and boys’ educational performance has improved • Understanding disparities by race/ethnicity and family income level is critical to understanding girls’ and boys’ achievement
National Data Sources:9-14 CTE Data • Perkins data • Core Indicators on Nontraditional CTE • Participation in CTE programs preparing students for nontraditional fields • Completion of CTE programs preparing students for nontraditional fields • Peer Collaborative Resource Network: www.edcountability.net • Tools of the Trade: http://www.nwlc.org/pdf/NWLCToolsoftheTrade05.pdf
Data CollectionDisaggregation required in Perkins IV • Special Population • Underrepresented gender students in a nontraditional CTE program • Single Parent • Displaced Homemaker • Limited English Proficiency • Individuals with a Disability • Economically Disadvantaged • Gender • Male • Female • Race/Ethnicity • American Indian or Alaskan Native • Asian or Pacific Islander • Black, non-Hispanic • Hispanic • White- non-Hispanic
National Program Evaluations • Project Lead the Way: http://www.pltw.org/pdfs/AnnualReport-2007-Public-Release.pdf • Report 17% female enrollment nationally • Cisco Networking Academy Gender Initiative • Set a program enrollment benchmark: 30% female • National Center for Women in Information Technology: http://www.ncwit.org/pdf/2007_Scorecard_Web.pdf
Iowa data sources:9-12 CTE and Academic • The Annual Career and Technical Education High School Report 2007: http://www.iowa.gov/educate/archived/content/blogcategory/184/930/ • Women and minorities in STEM Programs at Iowa’s Public Universities and Project Lead the Way: http://www.iowamathscience.org/reports/Women_Minorities_in_STEM.pdf
Iowa data sources:Postsecondary • 2005 Progress Report to the State Board of Education on Iowa’s Community College System: http://www.iowa.gov/educate/index.php?option=com_content&view=article&id=283&Itemid=1440 • Women and minorities in STEM Programs at Iowa’s Public Universities and Project Lead the Way: http://www.iowamathscience.org/reports/Women_Minorities_in_STEM.pdf
What does the data tell us? • Indicates trends over time • Highlights potential data quality issues • Identifies gaps in performance between • Student groups – gender, race/ethnicity, special populations • Programs • Generates additional questions that need to be answered before implementing a solution