Download
1 / 20
200 likes | 290 Views
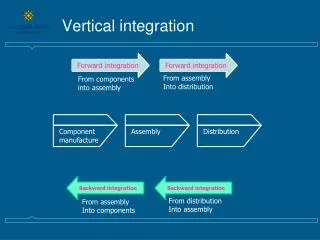
Shift from Vertical Integration to Network Forms of Production. Alternative constituting of the ‘value chain’ Premised on heterogeneous division of labor in Asia. Four Tiers of Asian Development. The four tiers: Japan NICS SEAsia, Coastal China, India Regions

E N D
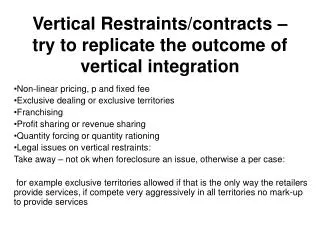
Shift from Vertical Integration to Network Forms of Production • Alternative constituting of the ‘value chain’ • Premised on heterogeneous division of labor in Asia
Four Tiers of Asian Development • The four tiers: • Japan • NICS • SEAsia, Coastal China, India Regions • Interior China, India, other SEAsia • NICS and High-Growth Asian Economies • World Bank View • In each, growth facilitated by: • Central elite bureaucracy focused on common goal: economic/tech catch-up and with an example: Japan • Insulated, generally stable political regime with elite civil service • Organized elites • Selected allocation of capital and other resources for targeted development and up-skilling • In each, marked differences in • Industrial structures – incl. Mix of state vs. private enterprise • Production profile • Mix of interventionist policies
NICS Adjustment • Common problems in 80s but different starting pts • Divergent adjustment strategies • Upgrade • Deepen • Diversify • Move laterally into services • Move off-shore • New markets • FDI • From production network standpoint: Sequential upgrading of foreign affiliates and indigenous firms • By 1990s: An elaborated regional division of labor built on heterogeneous but complementary production capabilities, w/high regional integration
Shares of regions/sub-regions as destinations for Asia’s electronics exports • By 1994, the Asia-regional market outside of Japan had become the most significant destination for Asia’s electronics exports • This reflects both emergence of NIC markets AND trade in semi-finished products and components Source: SIE World Trade database (based on UN/OECD trade statistics)
Shares of regions/sub-regions as sources of Asia’s electronics imports • Asia, outside of Japan also became the predominant source of imports of electronics products to the rest of Asia • This reflects significant specialization and cross-trade within the Asian electronics sector: One big regional production network Source: Same as previous chart
Shares of regions/sub-regions as destinations for Asia’s component exports • Rest of Asia, especially the NICs and increasingly, ASEAN, became the principle consumers of components in Asia • The US and Europe were still significant markets for components produced in Asia, but, typically, Japan was not • These data reflect the increasing significance of the NICs and ASEAN as production nodes for electronics products Source: Same as previous chart
Shares of regions/sub-regions as sources of Asia’s component imports • Japan’s position was still quite strong as the leading supplier of high-value components to the rest of Asia • But, NICs and US fdi created a growing base of component production in the rest of Asia Source: Same as previous chart
Fab Capacity by Location and Ownership Source: Leachman and Leachman in Macher, Mowery, Simcoe
Shares of Regions/sub-regions as destinations for Asia’s Computer System Exports • Not surprisingly, the US and Europe remained the principle export markets for Asia’s computer production • The rise of consumption in Asia, typically excluding Japan, reflected the growing internal regional market for computers Source: Same as previous chart
Shares of Regions/sub-regions as sources of Asia’s computer Imports • The rapid growth of PC production in the NICs and ASEAN displaced the US as the primary source of Asia’s computer imports. • Japan was marginalized as a significant production platform for PCs in the region (except by Japanese firms) • China began to emerge as a significant source of imports, which reflected its growth as a hub for components and board assembly in this period. Source: Same as previous chart
Shift from Vertical Integration to Network Forms of Production • Alternative constituting of the ‘value chain’ • Premised on heterogeneous division of labor in Asia • Built from sequential upgrading of foreign affiliates and indigenous firms • Elaborated, increasingly complementary division of labor with high regional integration • Under conditions of market uncertainty: advantages of speed and market adjustment • Exploiting increased technical specialization • NOT cheap labor, factor endowments, advantageous policies, market access or economizing on transaction costs!!!
Current Account - Trade Balances • Table 1: Current Account (% of GDP) • 1990 1991 1992 1993 1994 1995 1996 • Korea -0.69 -2.82 -1.28 0.31 -1.01 -1.81 -4.76 • Indonesia -2.82 -3.65 -2.17 -1.33 -1.58 -3.47 • Malaysia -2.03 -8.89 -3.76 -4.66 -6.23 -8.43 -5.20 • Philippines -6.08 -2.28 -1.89 -5.55 -4.60 -2.67 • Singapore 8.33 11.29 11.38 7.57 17.21 16.97 15.18 • Thailand -8.50 -7.67 -5.66 -5.09 -5.65 -8.09 -7.98 • Hong Kong • China 3.09 3.27 1.33 -1.93 1.28 0.23 0.89 • Taiwan 6.70 6.70 3.80 3.00 2.60 1.90 5.20 • Table 2: Trade Balance (% of GDP) • 1990 1991 1992 1993 1994 1995 1996 • Korea -0.81 -2.78 -1.37 0.19 -1.01 -1.40 -4.26 • Indonesia 1.68 0.91 1.81 1.48 0.72 -1.03 • Malaysia 2.10 -3.82 1.40 -0.11 -1.59 -3.75 0.58 • Philippines -5.73 -3.00 -4.27 -8.53 -8.95 -8.80 • Singapore 6.76 10.62 9.29 8.12 16.02 16.88 14.45 • Thailand -7.75 -6.84 -4.71 -4.57 -5.23 -7.12 -6.55 • Hong Kong • China 2.75 2.86 1.03 -1.91 1.41 1.71 2.15 • Taiwan Note: BOP Definition Sources: · International Finance Statistics of the International Monetary Fund · Data for Taiwan are from various sources (Economist Intelligence Unit Reports, IMF’s Dec 1997 WEO and Asian Development Bank)
Current Account and Capital Flows • (In billions of U.S. dollars) • 1994 1995 1996 1997* 1998** • Current account balance -24.6-41.3 -54.9 -26.0 17.6 • External financing, net 47.4 80.9 92.8 15.2 15.2 • Private Flow, net 40.5 77.4 93.0 -12.1 -9.4 • Equity investment 12.2 15.5 19.1 -4.5 7.9 • Direct equity 4.7 4.9 7.0 7.2 9.8 • Portfolio equity 7.6 10.6 12.1 -11.6 -1.9 • Private creditors 28.2 61.8 74.0 -7.6 -17.3 • Commercial banks 24.0 49.5 55.5 -21.3 -14.1 • Nonbank private creditors 4.2 12.4 18.4 13.7 -3.2 • Official flows, net 7.0 3.6 -0.2 27.2 24.6 • Int’l financial institutions -0.4 -0.6 -1.0 23.0 18.5 • Bilateral creditors 7.4 4.2 0.7 4.3 6.1 • Resident lending/other, net1-17.5 -25.9 -19.6 -11.9 -5.7 • Reserves excl. gold (-= increase) -5.4 -13.7 -18.322.7 -27.1 Note: The five economies consist of Indonesia, Korea, Malaysia, the Philippines, and Thailand *Estimate **IIF Forecast 1Including resident net lending, monetary gold, and errors and omissions. Data: Institute of International Finance
European Total • U.S. Japanese Union International • Banks Banks Banks Lending • China2.7 17.8 26.0 55.0 • Hong Kong SAR2 8.7 87.5 86.2 207.2 • Indonesia 5.3 22.0 21.0 55.5 • Korea 9.4 24.3 33.8 100.0 • Malaysia 2.3 8.2 9.2 22.2 • Philippines 3.9 1.6 6.3 13.3 • Singapore2 5.7 58.8 102.9 189.3 • Taiwan Province 3.2 2.7 12.7 22.4 • of China [Sic] • Thailand 5.0 37.5 19.2 70.2 • Vietnam 0.2 0.2 1.0 1.5 • East Asia total 46.4 260.6 318.3 736.6 International Bank Lending to East Asia1(In billions of U.S. dollars) (As % Bank Capital – emerging markets) 34% 117.8% 78.5% Source: Bank for International Settlements 1Outstanding at end-1996. 2The data for Hong Kong SAR and Singapore reflect their roles as international financial centers.
Non-Performing Loans of Banks(Post-Crisis) as % of GDP Non-performing Loans as a % of Shareholders’ Equity Japanese Bank
Asia GDP, Pre and Post Crisis • Most Asian economies still have not recovered fully recovered from Crisis • Only China is in a better position than pre-Crisis • EAsian GDP : 2002: 5%, 2001: 3%, 2000: 7% (last tech boom year!) • Financial System Reform is key to future prospects! Source: Economist Intelligence Unit
Capital Structure as a % of GDP, 2001 Source: FIBV; CEIC; Bloomberg; government stats; Economist
Non-Performing Loans, 2001 • Only a few countries have made progress in cleaning up the banking system mess • Only China and South Korea (and India, maybe Taiwan) even acknowledge the real extent of the problem • South Korea may be furthest along in resolving the problem Source: Ernst & Young; Economist
Structural Reforms and Recovery • Structural Reform of the Banking Systems most advanced in Korea among affected economies, least in Indonesia and Thailand • Korea experience: • Re-capitalize and rationalize banking sector Rationalized industrial sector (reinforcing better run Chaebol dominance) • Incentivize consumer spending and fdi • Japan experience: • Negative impact of delaying reforms • Estimated $1.2 trillion of Asia’s $2 trillion in non-performing loans resides in Japan • Only half-steps to reform – incomplete rationalization and re-capitalization – despite removing $300 billion in bad loans since 1997, aggregate figure has not fallen!