Download
1 / 57
570 likes | 660 Views
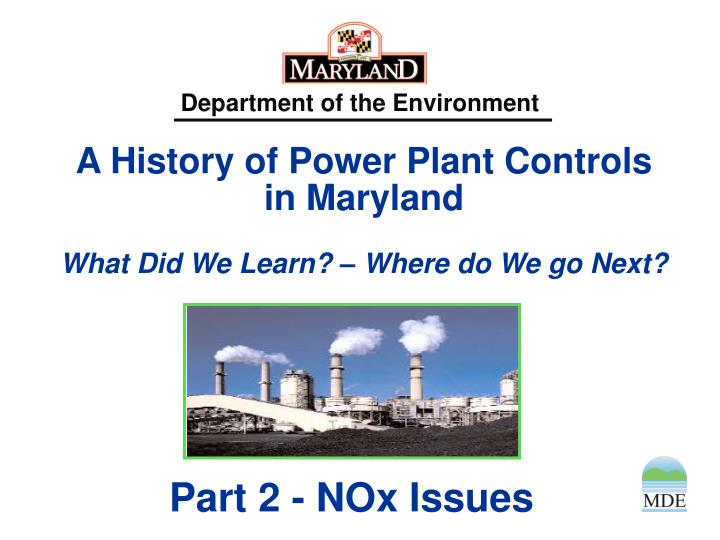
A History of Power Plant Controls in Maryland What Did We Learn? – Where do We go Next?. Part 2 - NOx Issues. 2014 NOx RACT Requirement. In 2014, MDE is required to update NOx RACT (Reasonably Available Control Technology) requirements in the Maryland SIP (State Implementation Plan)

E N D
A History of Power Plant Controlsin MarylandWhat Did We Learn? – Where do We go Next? Part 2 - NOx Issues
2014 NOx RACT Requirement • In 2014, MDE is required to update NOx RACT (Reasonably Available Control Technology) requirements in the Maryland SIP (State Implementation Plan) • RACT must be updated every time a new standard is adopted • The current 75 ppb standard was adopted in 2008 • The updated NOx RACT SIP is due on July 20, 2014 • This rulemaking process is intended to support that SIP submittal
Issues With NOx Emissions • The new 75 ppb ozone standard requires us to focus on peak day NOx emissions • Healthy Air Act (HAA) annual and “ozone season” caps have not forced units to always run emissions controls when they are needed • Linked to lower capacity factors at many units • Coal units are simply not being asked to run as often as they used to run • Some units also appear to not always be running their control equipment at a high level of efficiency to insure maximize emission reductions
Very Old Short-Term Emission Limits • The HAA used ozone-season and annual caps to drive very significant emission reductions of NOx • The short-term limits for NOx in Maryland regulations date back to the 1990s • For the new 75 ppb ozone standards, peak day NOx emissions have become extremely important • Current short-term limits are clearly not appropriate for addressing peak day NOx emissions • All short-term limits for all units will need to be updated
Decreasing Capacity Factors • Capacity factor HAA Coal Fired Units Capacity Factors of Maryland Coal plants have almost been reduced by 50%
Compliance with the HAA • All of Maryland’s power generators fully comply with the Maryland HAA of 2006 • The HAA used a regulatory scheme that allowed companies to choose where to control within their “system” to most cost-effectively meet the NOx and SO2 caps set in the Act. • Some units controlled more – some less • The HAA set annual caps for SO2 and annual and ozone season caps for NOx • Short-term limits (hourly or daily) were not part of the HAA • Caps were set assuming that Maryland coal plants would continue to operate at pre-2006 levels
The HAA Worked Well • The regulatory scheme in the HAA worked very well • Helped bring Maryland into attainment for the PM Fine standard and helped Maryland get very close to meeting the old 85 ppb ozone standard. • The HAA (2006) was designed for these older standards • The new 1-hour SO2 standard and the current 75 ppb ozone standard will require an enhanced regulatory scheme that focuses on: • Individual units and • Shorter term (hourly or daily) emission limits
Daily NOx Emissions By Plant NOx Emissions on Peak Ozone Days Crane is largest peak day contributor by plant
NOx Emissions on Peak Ozone Days Daily NOx Emissions By Unit Dickerson and Chalk have single stacks for multiple units Larger units with SCRs (Brandon Shores, Wagner 3, Morgantown and Chalk 1) are the lower peak day emitters Smaller units without SCRs (Crane, Wagner 2, Chalk 2 and Dickerson) are the higher peak day emitters
Raven Power Brandon Shores Wagner Power Station H A Wagner • Fort Smallwood Complex • Brandon Shores - Units 1 and 2 • Wagner – Units 1, 2, 3 and 4 • All on one contiguous property • C.P. Crane – Units 1 and 2 C P Crane
Raven System Wide Compliance with MD HAA HAA set annual and ozone season caps and allowed “system-wide” averagingWith tougher ozone standard and focus on “peak days” – unitsthat “under-controlled” are now being re-evaluated These two numbers show annual tons very close to annual limit These two numbers show ozone season tons very close to the ozone season limit Units with Red font use credits from units in Grey font to meet annual HAA Limit
Brandon Shores • Built in 1984 • Boiler type - Brandon Shores 1 and 2 are both Babcock & Wilcox wall fired Units • Installed 2 Selective Catalytic Reduction (SCR) control systems in 2002 ($100M, and a cost of around 4% plant efficiency) • Total capacity = 1,400 MW
2010 to 2012 Data Brandon Shores Unit 1 Ozone Season Versus Non Ozone Season Operation In non Ozone Season the SCR is operated at lower efficiency - or not at all In Ozone Season the SCR is operated at high efficiencies to achieve Maximum NOx Reduction
Current Controls - SCR Much higher rates for significant periods when SCRs are not being run efficiently Brandon Shores Unit 1 - 2012 Very low rates when SCRs are being run efficiently MDE Current Thinking: Allowable rate of 0.06 to 0.10 lb/mmBtu as a 24-hour Rolling Average (24hr RA)
Brandon Shores Unit 2 - 2012 Current Controls - SCR Much higher rates for significant periods when SCRs are not being run efficiently Very low rates when SCRs are being run efficiently MDE Current Thinking: Allowable rate of 0.08 to 0.11 lb/mmBtu (24hr RA)
Brandon Shores 1 and 2 - Conclusions • Continuous operation of the NOx controls would have reduced 1,650 tons of NOx emissions in 2012. • Current thinking - 24 Hr Rolling Avg NOx Emission Limit of 0.06 to 0.10 lb/mmBtu for Unit 1 • Current thinking - 24 Hr Rolling Avg NOx Emission Limit 0.08 to 0.11 lb/mmBtu for Unit 2
Wagner Power Station • Built in 1959 - 1972 • Boiler types • Units 2 and 3 are both coal burning Babcock & Wilcox wall fired unit units • Units 1 and 4 are Babcock & Wilcox Gas and Oil units • Installed a SCR & SNCR control systems in 2003 & 2008 ($55M) • Total capacity = 1,400 MW
Current Controls - SCR Much higher rates for significant periods when SCRs are not being run efficiently Wagner Unit 3 Very low rates when SCRs are being run efficiently MDE Current Thinking: Allowable rate of 0.05 to 0.06 lb/mmBtu (24hr RA)
Wagner 3 - Conclusion • Operation of SCR at Wagner 3 similar to Brandon Shore SCR’s. • Continuous operation of controls could have reduced 213 tons of NOx in 2012 at Wagner 3. • MDE Current Thinking - 24 Hr Rolling Avg NOx Emission Limit 0.05 to 0.06 lb/mmBtu.
Wagner 2 Current Controls - SNCR Clearly can see when SNCR is being run with a higher removal efficiency
Wagner 2 - SNCR In Operation No SNCR Operation in the Ozone Season 2012 MDE Current Thinking: Allowable rate of 0.25 to 0.35 lb/mmBtu (24hr RA) Some Operation of SNCR in Ozone Season 2011
Wagner 2 - SNCR Off The plant operated during 2012 Ozone season even though the SNCR was not operated The 0.25 to 0.35 lb/mmBtu limit would have required operation of the SNCR
Wagner 2 - Conclusions • The SNCR on Unit 2 ran 28% of time it could have run. • The SNCR did not run in the ozone season of 2012 at all. • Continuous operation of controls could have reduced 198 tons of NOx in 2012 at Wagner 2. • Current thinking - 24 Hr Rolling Avg NOx Emission Limit between 0.25 and 0.35 lb/mmBtu.
Raven Power – C.P. Crane • Built in 1963 • Boiler types • Units 1 and 2 are both coal burning cyclone units - Babcock and Wilcox Boilers • Installed SNCRs in 2009 ($12 M) • Total capacity = 400 MW
Capacity Factors at Crane • Dramatic reductions since 2001 to 2007 timeframe • Units are simply not being called upon to run as much as they used to be called upon
NOx Emissions on Peak Ozone Days Crane Unit 1 and 2 - Emissions 10 tons per day each
Crane Unit 1 – SNCR On Mixture of coal used in this area that doesn’t represent current operation MDE Current Thinking: Allowable rate of 0.25 to 0.35 lb/mmBtu (24hr RA)
Crane Unit 1 – SNCR Off Mixture of coal used in this area that doesn’t represent current operation The 0.25 to 0.35 lb/mmBtu limit would have required operation of the SNCR
2010-2012 - 24 Hr Avg NOx Lbs/mmBtu Mixture of coal used in this area that doesn’t represent current operation Crane Unit 2 – SNCR On MDE Current Thinking: Allowable rate of 0.25 to 0.35 lb/mmBtu (24hr RA)
Crane Unit 2 – SNCR Off 2010-2012 Data -24 Hr Avg NOx Lb/mmBtu Mixture of coal used in this area that doesn’t represent current operation The 0.25 to 0.35 lb/mmBtu limit would have required operation of the SNCR
Deeper Reductions at Crane • MDE is researching a hybrid SCR/SNCR technology that appears to be well suited for both Crane units • Appears to significantly reduce NOx • 0.08 to 0.11 lb/mmBtu • Very cost effectively • $2000 to $3000 per ton • Operational by 2015 to support Moderate area attainment needs
C.P. Crane – Conclusions • SNCR operation • Unit 1 SNCR ran 14% of time it could have. • Unit 2 SNCR ran 33% of time it could have. • Through 2015 • Current thinking – Unit 1 • Through 2015 - 24 Hr Rolling Average NOx Emission Limit of 0.25 to 0.35 lb/mmBtu. • Current thinking – Unit 2 • Through 2015 - 24 Hr Rolling Average NOx Emission Limit of 0.25 to 0.35 lb/mmBtu • By 2015 • Current thinking - Both Units • 24 Hr Rolling Average NOx Emission Limit of 0.08 to 0.11 lb/mmBtu
Raven Power – Current MDE Thinking Short-Term NOx Limits
NRG Energy Morgantown Dickerson Chalk Point • Morgantown - Units 1 and 2 • Dickerson – Units 1, 2 and 3 • Chalk Point – Units 1 and 2
Compliance with the HAA • All of Maryland’s power generators fully comply with the Maryland Healthy Air Act (HAA) • The HAA used a regulatory scheme that allowed companies to choose where to control within their “system” to most cost-effectively meet the NOx and SO2 caps set in the Act. • Some units controlled more – some less • The HAA set annual caps for SO2 and annual and ozone season caps for NOx • Short-term limits (hourly or daily) were not part of the HAA • Caps were set assuming that Maryland coal plants would continue to operate at pre-2006 levels
The HAA Worked Well • The regulatory scheme in the HAA worked very well • Helped bring Maryland into attainment for the PM Fine standard and helped Maryland get very close to meeting the old 85 ppb ozone standard. • The HAA (2006) was designed for these older standards • The new 1-hour SO2 standard and the current 75 ppb ozone standard will require an enhanced regulatory scheme that focuses on: • Individual units and • Shorter term (hourly or daily) emission limits
NRG System Wide Compliance with the HAA HAA set annual and ozone season caps and allowed “system-wide averagingWith tougher ozone standard and focus on “peak days” – unitsthat “under-controlled” are now being re-evaluated These two numbers show Annual tons emitted well under annual limit Units with Red font use credits from units in Grey font to meet annual HAA Limit These two numbers show Ozone Season tons emitted well under Ozone Season limit
NRG – Morgantown • Built in 1967 • Boiler types • Units 1 And 2 are both coal burning T-fired units - manufactured by Alstom • Installed SCR control systems in 2007 and 2008 (about $120M) • Total capacity = 1,280 MW
Morgantown Unit 1 Current Controls - SCR MDE Current Thinking: Allowable rate of 0.05 to 0.08 lb/mmBtu (24hr RA) Very low emission rates from SCR Unit
Current Controls - SCR Morgantown Unit 2 Very low emission rates from SCR Unit MDE Current Thinking: Allowable rate of 0.06 to 0.10 lb/mmBtu (24hr RA)
Morgantown - Conclusions • Both units experience excellent operation and run controls all year long • Current thinking - 24 Hr Rolling Avg NOx Emission Limit of 0.05 to 0.08 lb/mmBtu for Unit 1 • Current thinking - 24 Hr Rolling Avg NOx Emission Limit 0.06 to 0.10 lb/mmBtu for Unit 2
Chalk Point • Built in 1964, Boiler types: • Units 1 and 2 are both coal burning Combustion Engineering Wall fired units • Units 3 and 4 are oil fired • Installed a SCR control system on Unit 1 in 2008 ($60M) and a SACR control system on Unit 2 in 2006 ($20M) • Total capacity = 2000 MW
Chalk Point emissions - 14 tons per day (80% from SACR) NOx Emissions on Peak Ozone Days
Chalk Point - 2012 Current Controls – SCR on Unit 1 – SACR on Unit 2Both Units discharge through a common stack Emissions from Unit 2 SACR Combined Emissions from both Units Emissions from Unit 1 SCR MDE Current Thinking: Allowable rate of 0.1 to 0.15 lb/mmBtu (24hr RA)
Deeper Reductions at Chalk Point 2 • In filings with the U.S. Securities and Exchange Commission, GenOn Energy (now NRG) discussed plans to add SCR control technology at Chalk Point Unit 2 by the 2018 to 2021 timeframe • Because of Maryland’s severe ozone nonattainment problems, MDE believes these controls need to be implemented in a timeframe consistent with the CAA’s attainment deadlines • SCRs at Chalk Point 2 would significantly reduce NOx • 0.08 to 0.10 lb/mmBtu • Operational by 2015 to support Moderate area attainment needs
Chalk Point - Conclusions • SACR Selective Auto Catalytic system on Unit 2 much less efficient then SCR on Unit 1 • Results in high peak day NOx emissions • Current thinking: • Through 2015 - 24 Hr Rolling Average NOx Emission Limit of 0.10 to 0.15 lb/mmBtu for combined stack. • By 2015 - 24 Hr Rolling Average NOx Emission Limit of 0.08 to 0.10 lb/mmBtu for combined stack.
NRG - Dickerson • Built in 1960 • Boiler types • Units 1,2, & 3 are both coal burning Combustion Engineering T-fired units • Installed a SNCR control systems in 2009 ( $15M) • Total capacity = 570 MW
NOx Emissions on Peak Ozone Days Dickerson emissions – Over 12 tons per day from three units
Current Controls - SNCR Dickerson Units 1 2 & 3 - 2012 No operation of SNCR in 2012 MDE Current Thinking: Allowable rate of 0.15 to 0.20 lb/mmBtu (24hr RA) The 0.15 to 0.20 lb/mmBtu limit would have required operation of the SNCR
Deeper Reductions at Dickerson • In filings with the U.S. Securities and Exchange Commission, GenOn Energy (now NRG) discussed plans to add SCR control technology at Dickerson by the 2018 to 2021 timeframe • Because of Maryland’s severe ozone nonattainment problems, MDE believes these controls need to be implemented in a timeframe consistent with the CAA’s attainment deadlines • SCRs at Dickerson would significantly reduce NOx • 0.08 to 0.10 lb/mmBtu • Operational by 2015 to support Moderate area attainment needs


![Chapter 7: Computer-Assisted Audit Techniques [CAATs]](https://cdn0.slideserve.com/534186/chapter-7-computer-assisted-audit-techniques-caats-dt.jpg)