Download
1 / 21
210 likes | 331 Views
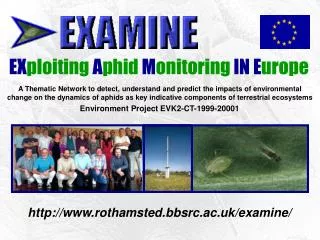
Intro Slide. EX ploiting A phid M onitoring IN E urope. A Thematic Network to detect, understand and predict the impacts of environmental change on the dynamics of aphids as key indicative components of terrestrial ecosystems. Environment Project EVK2-CT-1999-20001.

E N D
Intro Slide EXploiting Aphid Monitoring IN Europe A Thematic Network to detect, understand and predict the impacts of environmental change on the dynamics of aphids as key indicative components of terrestrial ecosystems Environment Project EVK2-CT-1999-20001 http://www.rothamsted.bbsrc.ac.uk/examine/
Global change Global Change Aphids and the environment Higher temperatures leads to increased number of generations Figure from Yamamura and Kiritani (1998) Appl. Entomol. Zool. 33, 289-298
Global change Global Change Aphids and the environment Warmer winters mean earlier aphid flights
Suction trapping Suction trapping The standard Rothamsted suction trap 12.2m (40ft) tall Airflow rate of ~45m3/min Samples represent a circular area of ~100km radius Aphids are separated from other insects and identified Aphids can be tested for viruses and genetic studies conducted Samples stored in ‘museum’
12.2m suction trapsoperating in 2002 original EXAMINE member other trap operator 61 currently operational Defunct traps 47 in total 1.5m traps 1 operational 5 defunct
Data Formats Historic data Data formats provided Database Excel Layouts: 216 different kinds of file layout Converted to XML using ad hoc Visual Basic applications
Data Formats Historic data Current database status About 80% of European suction trap data are available 28 traps have 20 or more years of data, 71 have more than 10 years Countries Traps with data Aphid species Site years Catch records Individual aphids Database size (bytes) Host plant information is also available Number of host plants 15 97 663 1324 1 912 630 25 614 711 3 268 000 000 1955
Web Site Database web site Users must submit to a ‘Data Access Agreement’ Password protected Mirror site to be set up at INRA - Le Rheu Data entry Data extraction and reporting Bulletin production General Administration Taxonomy database
Reporting Reporting Available information and data Summary trap information List of aphid species identified Annual totals and means of aphid catches Raw data Annual, monthly or weekly Summarised data nth aphid caught First n% of total catch Relative percentages Total between 2 time points
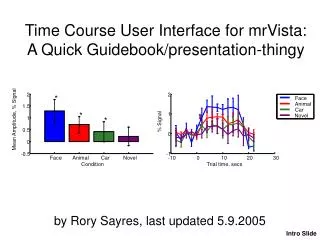
Graphical Output Reporting Graphical output Histograms with several options Other graph types (line graphs, pie charts etc) are under development
Example Data Example data Mean weekly count at Rothamsted 1965 to 2001 Acyrthosiphum pisum Mean annual count per trap 1965 to 2001 (mean traps/year = 40 3.25 s.e.) Extracted data plotted using Excel
Climate Data Complementary data Climate data (mean monthly) Climate Change Network Climatic Research Unit, UEA, UK Held on a 0.5 degree grid (1901 - 1995) ATEAM (Advanced Terrestrial Ecosystem Analysis and Modelling) Potsdam Institute for Climate Impact Research, Germany A 10 minute (1/6 degree) grid is used (1960 - 2000) Several global change scenarios have been modelled to 2020, 2050 and 2100 Variables supplied include: Mean temperature, diurnal temperature range, precipitation, wet day frequency, cloud cover, vapour pressure
Land Use Data Complementary data Land use data PELCOM (Pan - European Land Cover Monitoring) Based on the integrative use of multispectral and multitemporal 1 km resolution NOAA-AVHRR satellite data and ancillary data Other land use datasets available include CORINE, SEI and IGBP
Land use data sampling Supplementary data Land use data Data source: Grid 5km X 5km, Buffer : R = 50 km Data source Buffer Extraction + Intersect
Pollution Data Complementary data Pollution data EMEP (Co-operative Programme for Monitoring and Evaluation of the Long-Range Transmission of Air Pollutants in Europe) SO2, NO2 and O3 concentrations for 1990 to 1999 UK data Emissions of Nitrogen oxides in 1999 at 50 km resolution 1500 monitoring stations SO2 from 1958 NO2 and O3 from 1985
Traps : latitude, longitude, altitude Aphid data CORINE land cover classes PELCOM land cover classes Agricultural censuses Climate Pollution Analyses Summary Analyses Approaches 29 aphid species chosen Auto-correlation REML (residual maximum likelihood analysis) Artificial neural nets
Auto-correlation Analyses Auto-correlation Tests for correlation of data between traps at different distances from each other Kriging and semi-variogram approaches used Moran’s index calculated (an index of auto-correlation) Average correlogram 1989 - 2001 As distance increases, auto-correlation decreases
REML Analyses REML (Residual maximum likelihood analysis) Simultaneously models both the mean and spatial structure in the data The mean model takes account of patterns that can be directly attributed to environmental factors such as geographical position, climate, land use and pollution The spatial model describes the correlation pattern of the residuals y co-ordinate / 1000 x co-ordinate / 1000 Fitted prediction standard errors for annual totals of Myzus persicae in 1981 in the UK. Reference: Patterson and Thomson (1971) Biometrika 31, 100-109
Future Work Future work Aphid data Convert and upload remaining data from both original and new EXAMINE members Analyses Artificial neural networks Used to suggest interesting variables to investigate Conduct analyses on the 29 key species using climate, land use and pollution variables Improve web pages Evolve web site Ongoing
Acknowledgements Acknowledgements The European Union Rothamsted Research, UK Richard Harrington, Paul Verrier, the Rothamsted Insect Survey, Suzanne Clark, Sue Welham and Joe Perry INRA-Le Rheu, France Maurice Hullé and Damien Maurice Université catholique de Louvain, Belgium Mark Rounsevell and Nadège Cocu Imperial College of London Nigel Bell, Jon Knight and Adrian Leach All EXAMINE participants and new members Climate, land use and pollution data suppliers
Contact details Contact details The aphid data held by EXAMINE are available to the scientific community If you want access to these data... WWW http://www.rothamsted.bbsrc.ac.uk/examine/ Email richard.harrington@bbsrc.ac.uk (Project co-ordinator) colin.denholm@bbsrc.ac.uk (UK Technical co-ordinator)