Download
1 / 49
490 likes | 606 Views
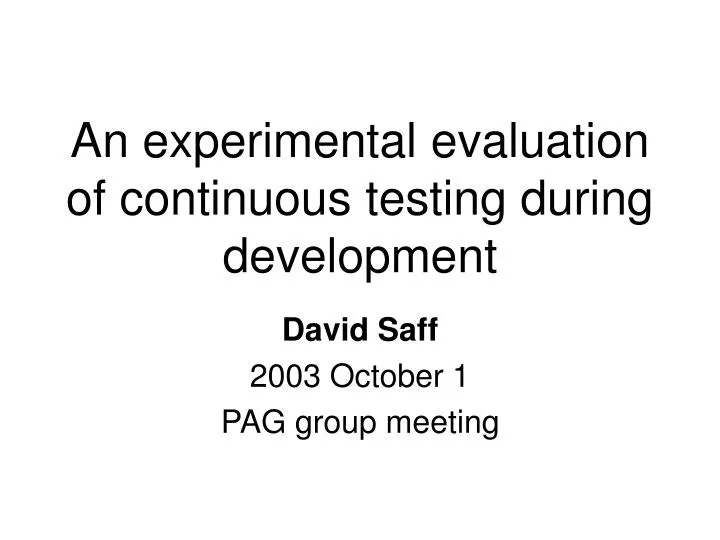
An experimental evaluation of continuous testing during development. David Saff 2003 October 1 PAG group meeting. Overview. Continuous testing automatically runs tests in the background to provide feedback as developers code.

E N D
An experimental evaluation of continuous testing during development David Saff 2003 October 1 PAG group meeting
Overview • Continuous testing automatically runs tests in the background to provide feedback as developers code. • Previous work suggested that continuous testing would speed development • We performed a user study to evaluate this hypothesis • Result: Developers were helped, and not distracted
Outline • Introduction • Tools Built • Experimental Design • Quantitative Results • Qualitative Results • Conclusion
Continuous Testing • Continuous testing uses excess cycles on a developer's workstation to continuously run regression tests in the background as the developer edits code. developer changes code system notifies about errors system notified about changes system runs tests
Previous Work • Monitored two single-developer software projects • A model of developer behavior interpreted results and predicted the effect of changes on wasted time: • Time waiting for tests to complete • Extra time tracking down and fixing regression errors
Previous Work: Findings • Delays in notification about regression errors correlate with delays in fixing these errors. • Therefore, quicker notification should lead to quicker fixes • Predicted improvement: 10-15%
Introduction: Basic Experiment • Controlled human experiment with 22 subjects. • Each subject performed two unrelated development tasks. • Continuous testing has no significant effect on time worked • Continuous testing has a significant effect on success completing the task. • Developers enjoy using continuous testing, and find it helpful, not distracting.
SECTION: Tools Built • TODO: Put outline here once it is solid
JUnit wrapper Wrapper Junit • Reorder tests • Time individual tests Test Suite Test Suite • Remember results • Output failures immediately • Distinguish regressions from unimplemented tests • Reorder and filter result text Results Results
Emacs plug-in • On file save, or 15-second pause with unsaved changes, run a “shadow” compile and test. • Display results in modeline: • “Compilation Errors” • “Unimpl Tests: 45” • “Regression Errors: 2” • Clicking on modeline brings up description of indicated errors.
Shadow directory • The developer’s code directory is “shadowed” in a hidden directory. • Shadow directory has state as it would be if developer saved and compiled right now. • Compilation and test results are filtered to appear as if they occurred in the developer’s code directory.
Monitoring • Developers who agree to the study have a monitoring plug-in installed at the same time as the continuous testing plug-in. • Sent to a central server: • Changes to the source in Emacs (saved or unsaved) • Changes to the source on the file system • Manual test runs • Emacs session stops/starts
SECTION: Experimental Design • TODO: Put outline here once it is solid
Participants • Students in MIT’s 6.170 Laboratory in Software Engineering class. 107 total students 34 agreed participants 73 non-participants 14 excluded for logistical reasons 20 successfully monitored (averages both tasks) 25% (6) no tools 25% (5) compilation notification only 50% (9) compilation and test error notification
Demographics: Experience (1) • Relatively inexperienced group of participants
Demographics: Experience (2) Usual environment: Unix 29%, Windows 38%, both 33%
Problem Sets • Participants completed (PS1) a poker game and (PS2) a graphing polynomial calculator.
Test Suites • Students were provided with test suites written by course staff. • Passing tests correctly was 75% of grade.
Sources of data • Quantitative: • Monitored state changes • Student submissions • Grades from TA’s • Qualitative: • Questionnaire from all students • E-mail feedback from some students • Interviews and e-mail from staff
SECTION: Quantitative Results • TODO: Put outline here once it is solid
Success Variables • time worked: See next slide • grade: as assigned by TAs. • errors: Number of tests that the student submission failed. • correct: True if the student solution passed all tests.
x x x x x x :00 :05 :10 :15 :20 :25 :30 :35 :40 :45 :50 :55 :00 x = source edit More variables: where students spent their time • All time measurements used time worked, at a five-minute resolution: • Some selected time measurements: • Total time worked • Ignorance time • between introducing an error and becoming aware of it • Fixing • between becoming aware of an error and fixing it
Treatment predicts correctness p < .03
Other predictions • Problem set predicts time worked • On PS1 only, years of Java experience predicts correctness • No other interesting predictions found at the p < .05 level • No effect on working time seen • student time budgets may have had an effect.
Ignorance and fix time • Ignorance time and fix time are correlated, confirming previous result. • Chart shown for the single participant with the most regression errors
Errors over time • Participants with no tools make progress faster at the beginning, then taper off; may never complete. • Participants with automatic tools make steadier progress.
SECTION: Qualitative Results • TODO: Put outline here once it is solid
How did working habits change? • “I got a small part of my code working before moving on to the next section, rather than trying to debug everything at the end.” • “It was easier to see my errors when they were only with one method at a time.” • “The constant testing made me look for a quick fix rather than examine the code to see what was at the heart of the problem.”
Positive feedback • “Once I finally figured out how it worked, I got even lazier and never manually ran the test cases myself anymore.” • Head TA: “the continuous testing worked well for students. Students used the output constantly, and they also seemed to have a great handle on the overall environment.”
Pedagogical usefulness • Several students mentioned that continuous testing was most useful when: • Code was well-modularized • Specs and tests were written before development. • These are important goals of the class
Negative comments • “Since I had already been writing extensive Java code for a year using emacs and an xterm, it simply got in the way of my work instead of helping me. I suppose that, if I did not already have a set way of doing my coding, continuous testing could have been more useful.” • Some didn’t understand the modeline, or how shadowing worked.
Suggestions for improvement • More flexibility in configuration • More information about failures • Smarter timing of feedback • Implementation issues • JUnit wrapper filtered JUnit output, which was confusing. • Infinite loops led to no output. • Irreproducible failures to run. • Performance not acceptable on all machines.
SECTION: Conclusion • TODO: Put outline here once it is solid
Threats to validity • Participants were relatively inexperienced • 2.8 years programming experience • Only 0.4 with Java • 67% were not familiar with regression testing. • Can’t predict what effect of more experience would have been. • This was almost a worst-case scenario for continuous testing: • Testing was easy. • Regression errors were unlikely
Future Work • We can’t repeat the experiment: continuous testing helps, and we ethically can’t deny it to some students. • Case studies in industry • Extend to bigger test suites: • Integrate with Delta Debugging (Zeller) • Better test prioritization • Test factoring: making small tests from big ones.
Conclusion • Continuous testing has a significant effect on developer success in completing a programming task. • Continuous testing does not significantly affect time worked • Most developers enjoy using continuous testing, and find it helpful.
The End • Thanks to: • Michael Ernst • 6.170 staff • participants
Introduction: Previous Work: Findings • Finding 2: Continuous testing is more effective at reducing wasted time than: • changing test frequency • reordering tests • Finding 3: Continuous testing reduces total development time 10 to 15%
Reasons cited for not participating Students could choose as many reasons as they wished. • Other IDE’s cited, in order of popularity: • Eclipse • text editors (vi, pico, EditPlus2) • Sun ONE Studio • JBuilder
Variables that predicted participation • Students with more Java experience were less likely to participate • already had work habits they didn’t want to change • Students with more experience compiling programs in Emacs were more likely to participate • We used a control group within the set of voluntary participants—results were not skewed.
Problem Sets • Participants completed several classes in a skeleton implementation of (PS1) a poker game and (PS2) a graphing polynomial calculator.
Test Suites • Students were provided with test suites written by course staff. • Passing tests correctly was 75% of grade.