Download
1 / 17
170 likes | 249 Views
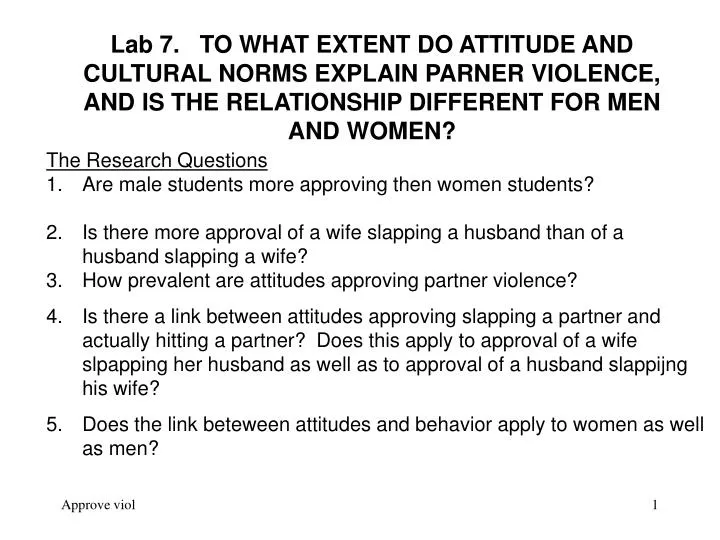
Lab 7. TO WHAT EXTENT DO ATTITUDE AND CULTURAL NORMS EXPLAIN PARNER VIOLENCE, AND IS THE RELATIONSHIP DIFFERENT FOR MEN AND WOMEN?. The Research Questions Are male students more approving then women students?

E N D
Lab 7. TO WHAT EXTENT DO ATTITUDE AND CULTURAL NORMS EXPLAIN PARNER VIOLENCE, AND IS THE RELATIONSHIP DIFFERENT FOR MEN AND WOMEN? • The Research Questions • Are male students more approving then women students? • Is there more approval of a wife slapping a husband than of a husband slapping a wife? • How prevalent are attitudes approving partner violence? • Is there a link between attitudes approving slapping a partner and actually hitting a partner? Does this apply to approval of a wife slpapping her husband as well as to approval of a husband slappijng his wife? • Does the link beteween attitudes and behavior apply to women as well as men?
INDIVIDUAL ATTITUDES AND CULTURAL NORMS * ATTITUDES A psychological or social psychological construct of * CULTURAL NORMS A sociological/anthropological concept Two sides of a coinThe average or typical attitude is one way of determining what the norms are If most people in a society or sector of society believe that: 1. Spanking children is sometimes necessary 2. Marrying someone of a different race or religion should be avoided 3. Believe there are circumstances when they would approve a husband slapping a wife We can interpret this as evidence that the cultural norms 1. Approve of corporal punishment 2. Disapprove of interracial marriage 3. Approve or permit hitting a partner This lab uses individual students, not sites in different countries, as the units of study. So the research is on how much individual attitudes are related to the behavior of individual students. But if a majority of students approve, we can take that as evidence of cultural norms approving partner violence
MEASURING APPROVAL OF PARTNER VIOLENCE VA10. I can think of a situation when I would approve of a husband slapping a wife’s face VA09. I can think of a situation when I would approve of a wife slapping a husband’s face 1 = Strongly Disagree 2 = Disagree 3 = Agree 4 = Strongly Agree We will use the answers in two ways: * To compare men and women students, and to compare approval of violence by men (question VA10) and violence by women (question VA09: We will use the percent who did not "Strongly Disagree" * To see if more approval is related to more actual hitting: We will compare students in the 4 answer categories with each other.
MEASURE OF VIOLENCE AGAINST A DATING PARTNER: THE CONFLICT TACTICS SCALES TOTAL VIOLENCE SCALE = BOTH MINOR AND SEVERE ASSAULTS.
HYPOTHESESWrite a hypothesis about questions 2, 3, 4, and 5 Number them. Because there are 4, be brief SAMPLE: About 7,500 students at 26 Universities in 14 countries INDEPENDENT AND DEPENDENT VARIABLES Enter what the variables are on the lab report Explain how each was measured, and give an example of one of the questions "MODERATOR VARIABLE" We will use the gender of the student to find out if the relation of pro-violence attitudes to violent behavior applies to women as well as men
COMPUTER ANALYSIS TO TEST THE HYPOTHESES With a sample of 7,500 students, it is not possible for us to cross-tabulate the data by hand (as we did using the data for just this class in Lab 2) I will use the SPSS statistical program to run the analysis. The program will show the relationship between the attitudes and behavior and also provide a test of significance. LOCATION OF THE RESULTS Questionsd 1, 2, 3: Table 2 Question 4 : Charts 1 and 3 Question 5: Charts 2 and 4 Tests of significance: Tables 3 and 4
RESULTS AND DISCUSSION SECTIONS OF LAB REPORT RESULTS Number them, as in slide 1 Location Of The Results Questions 1, 2, 3: Table 2 Question 4 : Charts 1 and 3 Question 5: Charts 2 and 4 Tests of significance: Tables 3 and 4 DISCUSSION Answer one of the following (the “why” part is the important part of what should be in this section) * Were any of the results surprising? Why or why not? * Which of the results did you find the most interesting and why was it interesting to you?
. Table 2. APPROVAL OF PARTNER VIOLENCE BY GENDER OF PERPETRATOR AND GENDER OF STUDENT PERCENT WHO DID NOT STRONGLY DISAGREE THAT THEY COULD… GENDER OF STUDENT MALES FEMALES p < ….think of a situation when I would approve of a husband slapping a wife’s face 48.7% 39.3% .005 ….think of a situation when I would approve 75.4% 74.8% .64 of a wife slapping husband’s face
CHART 1. PERECENT VIOLENT BY APPROVAL OF A HUSAND SLAPPING HIS WIFE
CHART 2. PERCENT VIOLENT BY APPROVAL OF A HUSAND SLAPPING HIS WIFE AND GENDER OF THE STUDENT
Table 3. ANALYSIS OF COVARIANCE TO TEST THE SIGNIFICANCE OF THE DIFFERENCES IN CHARTS 1 AND 2 Dependent Variable: CTATSP ASSAULT TOT by self - prev Type III Sum of Source Squares df Mean Square F Sig. a Corrected Model 393037.385 8 49129.673 25.093 .000 Intercept 690301.773 1 690301.773 352.578 .000 SDT1 304009.836 1 304009.836 155.276 .000 (sex) approve A01 15786.575 1 15786.575 8.063 .005 (approve VA10 15571.678 3 5190.559 2.651 .047 A01 * VA10 3481.974 3 1160.658 .593 .620 Error 10400196.970 5312 1957.868 Total 15050000.000 5321 Corrected Total 10793234.354 5320 a. R Squared = .036 (Adjusted R Squared = .035)
CHART 3. RELATION OF APPROVAL OF A WIFE SLAPPING A HUSBAND TO THE PROBABILITY OF A STUDENT BEING VIOLENT TO A DATING PARTNER IN THE PAST YEAR
CHART 4. PERCENT VIOLENT BY APPROVAL OF A WIFE SLAPPING HER HUSBAND AND GENDER OF THE STUDENT
Table 4. ANALYSIS OF COVARIANCE TO TEST THE SIGNIFICANCE OF THE DIFFERENCES IN CHART S 3 AND 4 Dependent Variable: CTATSP ASSAULT TOT by self - prev Type III Sum of Source Squares df Mean Square F Sig. a Corrected Model 413968.729 8 51746.091 26.468 .000 Intercept 640983.294 1 640983.294 327.856 .000 SDT1 281094.449 1 281094.449 143.777 .000 (sex) approve A01 24432.134 1 24432.134 12.497 .000 VA09 16635.061 3 5545.020 2.836 .037 A01 * VA09 16570.716 3 5523.572 2.825 .037 Error 10397091.906 5318 1955.076 Total 15080000.000 5327 Corrected Total 10811060.635 5326 a. R Squared = .038 (Adjusted R Squared = .037)
WHAT HAS BEEN LEARNED FROM THIS LAB? • Are male students more approving then women students? • Is there more approval of a wife slapping a husband than of a husband slapping a wife? • How prevalent are attitudes approving partner violence? • Is there a link between attitudes approving slapping a partner and actually hitting a partner? Does this apply to approval of a wife slpapping her husband as well as to approval of a husband slappijng his wife? • Does the link beteween attitudes and behavior apply to women as well as men?