Download
1 / 21
210 likes | 326 Views
Evaluation of bone mineral density and body composition among patients on second-line ART. EARNEST: E urope A frica R esearch N etwork for E valuation of S econd-line T herapy. Definitive RCT to evaluate options for 2nd-line therapy in patients failing first-line ART regimens

E N D
Evaluation of bone mineral density and body composition among patients on second-line ART
EARNEST: Europe Africa Research Network for Evaluation of Second-line Therapy • Definitive RCT to evaluate options for 2nd-line therapy in patients failing first-line ART regimens • Successor to DART trial • 1200 patients in 3 arms • To commence 04/10 in Uganda, Malawi, and Zimbabwe
Trial design 1200 ELIGIBLE PATIENTS RANDOMIZE bPI + RAL (12wk induction) bPI + 2 NRTI (NRTIs according to local standard of care) bPI + RAL bPI (Monotherapy) FOLLOW-UP FOR 144 WEEKS • Primary Outcome – • Good clinical HIV disease control –defined as: • No new WHO Stage 4 events during clinical trial • CD4 cell count > 250 cells/mm3 at wk 96 AND • VL < 10,000 copies/ml OR • VL >10,000 copies/ml with no PI resistance mutations (wk 96)
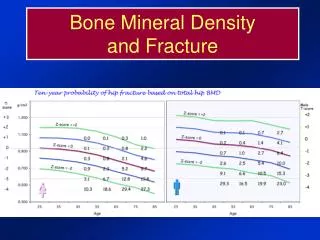
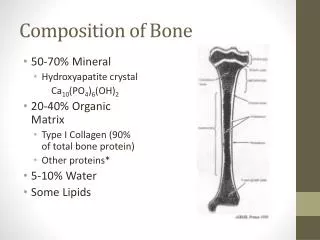
Background: BMD • TNF and d4T ART regimens associated with initial BMD loss • Continuous ART assoc with > BMD loss than intermittent ART • Little data from Sub-Saharan Africa • Suggests high level of unrecognisedosteopenia (57% had low BMD at ≥1 site in 217 HIV negative Botswanan men)
Background: Body Composition • Exposure to NRTIs (esp d4T) assoc with peripheral fat loss • Increases with duration of therapy • Less with TNF and abacavir, increased with PI • ? impact of virological failure
Sub-Study aims and hypotheses • To compare mean decline in BMD between randomised arms in patients who have failed first-line NRTI and NNRTI-containing ART • To compare mean changes in body composition (recovery of peripheral fat) between randomised arms • To compare mean changes in body composition (increase in central fat ) between randomised arms
Sample size calculation • 180 patients (60 in each treatment arm) • EARNEST patients at IDI, Kampala, Uganda • DEXA scans (whole body and bone) at baseline, (week 48, 96), 144
Baseline and follow-up assessmentsat weeks 48, 96 and 144 • Clinical and medication history • demographic information (main protocol) • previous and incident fractures • risk factors for and secondary causes of osteoporosis • Alcohol intake • Patient self-assessment of changes in body fat • Physician examination of body fat distribution • Questionnaire assessment of physical activity
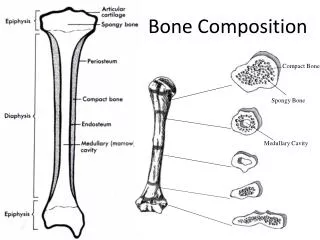
Baseline and follow-up assessmentsat weeks 48, 96 and 144 • Bone mineral density (lumbar spine and proximal femur) and body composition (total and regional (limb) body fat) studies using Hologic bone densitometer at Makerere University-John Hopkins University (MU-JHU) facility. • Body fat composition with Bioelectrical Impedance Analysis (BIA) using RJL101 machine. Impedance values converted to estimates of body cell mass (BMC) and extracellular water using validated equations.
Serum measures of Bone metabolism (Stored samples) • Serum vitamin D [25(OH) and 1,25 (OH)], Calcium • Intact PTH • Fibroblast growth factor-23 (FGF-23) • -Serum bone formation markers • osteocalcin, procollagen type 1 amino-terminal propeptide (P1NP), osteoprotegerin, tartrate-resistant acid phosphatase 5 (TRAP-5) • - Serum bone resorption markers • C-terminal telopeptidecrosslinks (CTX), • - Regulators of bone metabolism: • (OPG (osteoprotegrin) / RANKL (receptor activator of nuclear factor κB ligand) • - Urinary bone resorption markers • (hydroxyprolinepyridinoline (Pyr), urinary DPD (deoxypyridinolinecrosslinks), urine peptide-bound N-telopeptidecrosslinks (NTX)) • - Inflammatorymarkers • (TNF-alpha, IL1, IL6) • -Markers of adipose tissue metabolism • (leptin, adiponectin)
Statistical plan and Interim analysis • Initial data analysis will be performed after last patient enrolled in sub-study to examine bone mineral density and body composition at baseline. • Analyses of longitudinal changes according to baseline (switch to second-line) but not by randomised arm.
Primary outcome measures Bone Mineral Density: • Percentage change in proximal femur BMD from baseline to week 48 Body Composition: • Percentage change in limb fat from baseline to week 48.
Timelines • April 2010: Revised protocol and piloting og Dexa, BIA and questionnaires • May 2010: Submission and approval by JCRC ethics; final piloting of questionnaires • June 2010: Study initiation
Genetic determinants of HIV progression • Individuals vary considerably in their control of viral replication and rate of immunological progression. • Some of variation can be attributed to:- • immunogenetic diversity (MHC homozygosity, specific HLA types) • polymorphism in chemokine, chemokine receptor and cytokine genes (CCR5, CCR2, CX3CR1, SDF1, MIP1aCCL3L1, RANTES, IL-10, IL-4) • variation in genes involved in the HIV-1 life cycle and cellular defense (APOBEC3G, PML, PPIA, TSG101).
Genetic determinants of HIV-1 long-term non-progression • About 2% of HIV individuals maintain impressive viral control (viral load <500 or even <50 copies/ml) and stability in CD4 count (>500 cells) over ≥ 15-20 years of infection • described as long-term non-progressors (LTNP) or viral controllers • Knowledge of relevant host genetic factors remains limited and in Caucasian cohorts only. • existing cohorts are of insufficient size to meet requirements of power calculations and control for population stratification.
1. A whole-genome-association study identifies major determinants of the host control of HIV-1Science 2007(n=486 seroconverters)2. Common genetic variants and the control of HIV-1 in humans. PLOS Genetics 2010 (n=2554 seroconverters and seroprevalent)Three single nucleotide polymorphisms located in MHC region explained 14% of variation in viral setpoint and 10% of variation in disease progressionHCP5 T>G variant (HLA B5701) and T>C SNP in HLA-C
Kaplan-Meier survival estimates for the 3 most associated SNPs identified in the genome-wide progression scan and for CCR5-32
Correlation between HIV setpoint and the genotype of the top associated SNPs
A simple additive genetic score helps predict HIV disease progression
Selection of cases and controls identified from IeDEA database • “Elite controllers” • High and stable CD4 (>500 cells on two occasions over one year) • Plasma for viral load +/- whole blood for DNA • Low viral load <2000 copies/ml • Controls: “Poor viral load controllers” • Patients initiating ART • Pre-ART viral load and DNA • Costs • VL measurements, and ? Repeat CD4 • Research nurse at selected sites to arrange visit and take blood samples • Storage and transport of specimens • GWAS (Wellcome Trust Sanger or CHAVI)