Download

1 / 9
90 likes | 186 Views
3-3 Solving Systems of Inequalities by Graphing. Determine if line is dashed/solid (< or > -----> , ≤ or ≥ → ). Plug in any pt not on boundary (0, 0) is simplest if available. Find related equation ex) y < 5x + 6, y = 5x + 6. Put inequality in slope-int form y = m x + b.

E N D
Determine if line is dashed/solid (< or > ----->, ≤ or ≥ →) Plug in any pt not on boundary (0, 0) is simplest if available Find related equation ex) y < 5x + 6, y = 5x + 6 Put inequality in slope-int form y = mx + b Graph the related equation DO NOT SHADE THIS REGION!! SHADE OTHER ONE! Shade the region where the test point resides Review: Graphing Inequalities FALSE TRUE
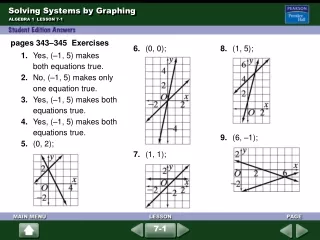
Identify the Solution Graph 2nd inequality (Solution: one shaded region in another color) Graph the 1st inequality (Solution: one shaded region) NO SOLUTION! ALL POINTS IN THE OVERLAPPED SHADING ARE SOLUTIONS Solving a System of 2 Inequalities SHADINGS OVERLAP NO OVERLAP
Homework • Text p. 126 (12-26 all)