Download
1 / 5
50 likes | 173 Views
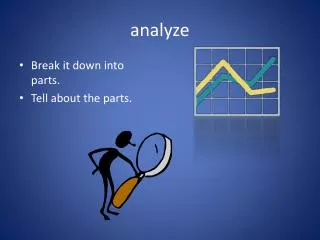
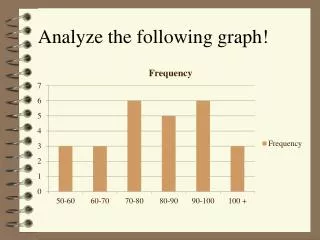
Analyze Graph Exercise. LINE GRAPH. A line graph is best for showing data that changes over a range. Analyze the Graph. Describe the experiment. The experimenter is measuring the change in volume of a gas over time What is the measuring interval selected by the experimenter?

E N D
LINE GRAPH A line graph is best for showing data that changes over a range.
Analyze the Graph • Describe the experiment. The experimenter is measuring the change in volume of a gas over time • What is the measuring interval selected by the experimenter? The experimenter selected a measuring interval of 10 seconds (independent variable on x-axis)
Describe what is happening from 0-40 s. The volume of gas begins to increase over time at an increasing rate. 3 ml per 10 s, then 6 ml per 10 s and 13 ml per 10 s • Describe what is happening from 40 s to 100 s. The volume of gas continues to increase, but at a more rapid rate. Volume rate increases range from 14 ml to 24 ml per 10 s • How are these two ranges the same? Different? Same: Both ranges show increases of gas volume over time Different: The 40 – 100 s range shows a more rapid rate of volume increase over time than the 0-40 s range.
Describe what is happening from 100 s to 140 s. How does this range differ from 40 s to 100 s? The volume of gas continues to increase, but at a much slower rate. 7 ml per 10 s, then 5 ml per 10 s, then 2 ml per 10 s • Describe what is happening from 140 s to 170 s. • There is no measured change in the volume of gas over time— • Volume remains unchanged at 156 ml • In one sentence, summarize the trend of the data as shown by the graph. • The trend of the graph is characterized by an unsteady increase in the volume of gas over time until the volume reaches a maximum value where no further increase occurs.