Download
1 / 31
310 likes | 363 Views
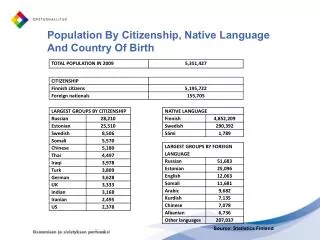
Statistical revisions were significant in the case of industrial output and are yet to come for GDP. Revised industrial output figures, y-o-y. 2010 GDP growth breakdown, y-o-y. GDP. 4.0%. Agriculture. -12.1%. Fishing. -4.7%. Raw materials extraction. 4.8%. Manufacturing. 13.4%.

E N D
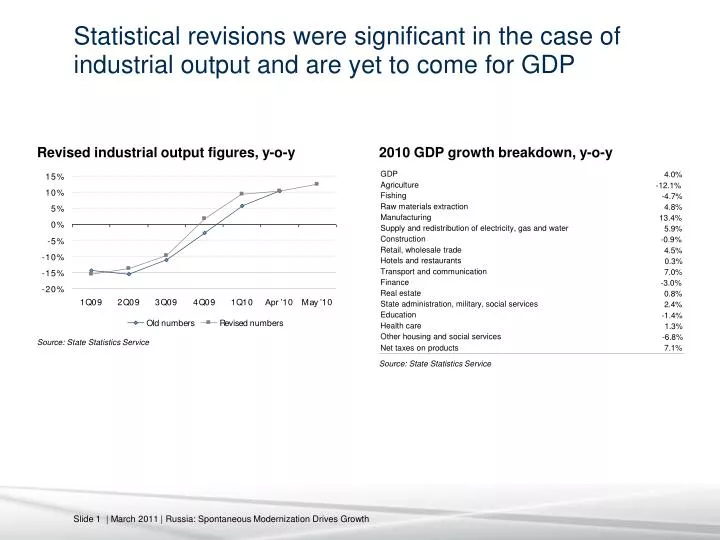
Statistical revisions were significant in the case of industrial output and are yet to come for GDP Revised industrial output figures, y-o-y 2010 GDP growth breakdown, y-o-y GDP 4.0% Agriculture -12.1% Fishing -4.7% Raw materials extraction 4.8% Manufacturing 13.4% Supply and redistribution of electricity, gas and water 5.9% Construction -0.9% Retail, wholesale trade 4.5% Hotels and restaurants 0.3% Transport and communication 7.0% Finance -3.0% Real estate 0.8% State administration, military, social services 2.4% Education -1.4% Health care 1.3% Other housing and social services -6.8% Source: State Statistics Service Net taxes on products 7.1% Source: State Statistics Service
Russian statistics keep eyebrows raised and eyes wide open 2010 2009* 2009*** 2009 2009** GDP 4.0% - 7.9% -7.8% -7.0% -7.9% Consumption 2.1% - 5.4% -3.7% -3.2% -5.1% Household consumption 2.7% - 8.1% -4.8% -7.7% -5.0% -0.5% Public sector consumption 0.7% 1.9% 2.0% 2.0% -8.7% Consumption of other sectors -1.5% - 1.8% 0.0% -1.4% Gross investments 24.3% - 37.6% -41.0% -37.4% -30.0% Fixed capital investments 3.5% - 18.2% -14.4% -17.0% -15.7% Changes in stocks – – – – – Net export of goods and services -27.3% 58.0% 56.7% 34.0% 56.8% * State Statistics Service (first estimate) ** State Statistics Service (second estimate) *** State Statistics Service (third estimate) Last column – Troika’s old estimate Source: State Statistics Service, Troika estimates
Retail Services Household Real disposable Real consumption incomes wages 1Q08 17.2% 7.4% 14.6% 7.5% 13.4% 2Q08 14.9% 5.4% 12.1% 5.7% 12.5% 3Q09 15.0% 5.1% 11.2% 4.5% 12.2% 4Q08 8.7% 1.8% 6.2% -6.9% 5.0% 2008 13.5% 4.8% 10.7% 1.9% 11.5% 1Q09 -0.1% -0.9% -2.6% 0.7% -0.8% 2Q09 -5.6% -4.7% -7.5% 3.4% -3.9% 3Q09 -9.2% -6.4% -10.8% -3.4% -5.2% 4Q09 -6.1% -4.4% -9.4% 8.2% -0.7% 2009 -5.5% -4.3% -7.7% 2.3% -2.8% “But actually, he thought as he re-adjusted the Ministry of Plenty’s figures, it was not even forgery. It was merely the substitution of one piece of nonsense for another” (George Orwell, Nineteen Eighty-Four) Source: State Statistics Service
2,000 2,000 2011 2008 2010 1,500 1,500 2007 2009 1,000 1,000 GDP, $ bln 2006 2004 2005 500 500 2003 1999 0 0 0 20 40 60 80 100 Urals, $/bbl Russia’s nominal GDP (in dollar terms) correlates with the oil price Source: State Statistics Service, Troika estimates
Rising oil price and expanding foreign borrowing failed to accelerate Russia’s growth: in principle, Russia can grow at any oil price Source: State Statistics Service, Troika estimates Source: State Statistics Service, Troika estimates
Growth and lending: searching for a more balanced combination Source: Central Bank, State Statistics Service
Following the short correction two years ago, consumption is rising steadily amid a resumption in consumer lending Growth accelerated amid excessively rapid credit expansion Source: State Statistics Service, Central Bank, Troika estimates
Bonds temporarily replaced loans in banks’ portfolios; the latter returned to growth in 2Q10 Bonds and loans in banks’ portfolios Source: Central Bank
Russia is returning to a more balanced model of economic development after several years of overheating Source: State Statistics Service, HSE, Troika estimates
New equilibrium: Since 1999, South Korea’s growth has moderated after decades of unbalanced investment-led growth Source: National statistics, Troika estimates
China: a balance is yet to be found… 20% 1984 15% 1992 1993 1987 2006 1978 1996 10% 2003 1986 2008 2009est GDP, y-o-y 1980 1999 1981 5% 1990 ? 0% -5% 25% 30% 35% 40% 45% 50% 55% Investments/GDP Source: National statistics, Troika estimates
GDP per capita in the former Soviet republicsin 1991 and 2009, $ Source: IMF
GDP per capita in the former Soviet republicsin 2009 and external borrowing Russia did not borrow a lot Russia 2010 Note: Data for 2009 Source: IMF, CIA, national banks
95 90 Optimistic 85 scenario Pessimistic scenario 80 mln 75 70 65 60 2000 2003 2006 2009 2012 2015 2018 Working age population Employment Russia will not face limitations on the labor market in the medium term… Source: State Statistics Service, Troika estimates
… although the share of the working age population in the total figure will continue to fall Expected population dynamic (left chart) and share of the working age population (right chart) Source: State Statistics Service
Budget revenues fell in 2009, but not as much as the government expected, R bln... 2005 2006 2007 2008 2009 2010E 7,784 7,338 Total revenues 5,127 6,276 7,779 9,274 – 195 Profit tax 378 510 641 761 – 510 Social tax 268 316 405 507 – VAT 1,472 1,511 2,262 2,132 2,050 – 982 Raw materials extraction tax 855 1,094 1,123 1,605 – Export duties 1,352 1,896 1,835 2,859 2,042 – Import duties 271 342 488 626 467 Other 533 608 1,026 784 1,092 – Note: The government initially forecast revenues in 2009 at R6,713.8 bln. In 11m10, revenues reached R7,432.4bln, while the deficit was R911.5 bln. Source: Finance Ministry
… but expenditures increased massively, R bln 2005 2006 2007 2008 2009 2010E 10,212 Total expenditures 3,514 4,281 5,983 7,567 9,660 839 State administration 501 530 812 835 829 1,264 National defense 581 682 832 1,041 1,188 1,096 National security 450 550 667 836 1,005 1,583 National economy 249 345 693 1,025 1,651 198 Housing sector 7 53 295 130 152 433 Education 162 212 295 355 418 341 Medical care, sport 88 148 197 278 352 329 Social policy 178 201 214 294 324 3,633 Transfers 1,246 1,499 1,900 2,675 3,594 Other 52 62 79 99 147 496 Note: The government initially planned expenditures in 2009 at R9,845.2 bln. Source: Finance Ministry
Larger government expenditures and an increased budget deficit in Russia usually mean worse economic performance Source: State Statistics Service, Finance Ministry, Troika estimates Source: State Statistics Service, Finance Ministry, Troika estimates
Government interventions were inflationary: public consumption shrank in real terms Public consumption to GDP ratio shrank in real terms, its contribution to economic growth diminished Deflator for public consumption remainedhigher than for other elements of GDP Source: State Statistics Service Source: State Statistics Service
The breakeven oil price has grown substantially over recent years, increasing budgetary risks Budgetary policy was generous and the Reserve Fund shrank in 2009-10, as the budget was in the red (right-hand chart) Source: Finance Ministry, Troika estimates
Finance Ministry has become too generous: expenditures set to grow November 2009, R bln 2009 2010E 2011E 2012E 2013E 7,336.0 6,950.0 8,077.0 8,549.0 9,147.6 Revenues 9,662.2 9,886.9 9,857.4 9,895.6 10,078.7 Expenditures -2,326.2 -2,936.9 -1,780.4 -1,346.6 -931.1 Federal budget deficit % of GDP -5.9% -6.8% -3.6% -2.4% -1.5% August 2010, R bln 2009 2010E 2011E 2012E 2013E 7,336.0 7,783.8 8,617.8 9,131.7 9,983.9 Revenues 9,662.2 10,212.4 10,385.1 10,844.6 11,749.1 Expenditures -2,326.2 -2,428.6 -1,767.3 -1,712.9 -1,765.2 Federal budget deficit % of GDP -5.9% -5.4% -3.6% -3.1% -2.9% September 2010, R bln 2009 2010E 2011E 2012E 2013E 7,336.0 7,783.8 8,843.8 9,502.7 10,378.9 Revenues 9,662.2 10,212.4 10,658.0 11,237.3 12,174.9 Expenditures -2,326.2 -2,428.6 -1,814.2 -1,734.6 -1,796.0 Federal budget deficit % of GDP -5.9% -5.4% -3.6% -3.1% -2.9% Source: Finance Ministry
Sources of deficit financing, R bln Source: Finance Ministry
Due to increased expenditures, the breakeven oil price will exceed $100/bbl Urals in 2011 Source: Troika estimates
Voluntary reserves increased as the Central Bank offered an attractive risk-free rate Voluntary reserves increasedsharply in 1H10 Central Bank deposit and bond rates Source: Central Bank, Troika estimates Source: Central Bank
The Central Bank has absorbed previously extended loans, R mln Source: Central Bank
M2 declined in nominal terms, but started to rise in February 2009, a sign that the economy is recovering (R bln); the sort of “currency board” regime is seemingly over: money is becoming endogenous ($ bln) Source: Central Bank, Troika estimates
The ruble has appreciated since February 2009 after the Central Bank stopped targeting the exchange rate, which became more volatile; the Central Bank’s role as lender of last resort grew in importance Source: Central Bank, Troika estimates Source: Central Bank
Historical exchange rate and oil price: new regime emerges as the Central Bank reduces interventions 40 2010 High oil price appreciates the ruble, while high domestic inflation depreciates it. 2009 36 32 2011 Exchange rate regime RUB/USD since February 2009 28 24 20 20 40 60 80 100 120 140 Urals $/bbl Source: Central Bank, Bloomberg, Troika estimates
Two regimes of targeting: currency first, money market second Volatility high on the money market, low on the forex market Volatility high on the forex market, low on the money market Source: Central Bank
Nominal interest have rates declined, but may go up again Source: Central Bank, State Statistics Service
Market capitalization and the money supply move together Source: Central Bank, State Statistics Service