Download
1 / 26
260 likes | 413 Views
QSG. QSG. Quality Support Group, Inc. Product and Process Measures Drive Continuous Product Quality and Business Improvement. Angelo G. Scangas, President Quality Support Group, Inc. 978-430-7611 www.qualitysupportgroup.com. QSG. QSG. Quality Support Group, Inc. What is on your mind?

E N D
QSG QSG Quality Support Group, Inc. Product and Process Measures Drive Continuous Product Quality and Business Improvement Angelo G. Scangas, President Quality Support Group, Inc. 978-430-7611 www.qualitysupportgroup.com
QSG QSG Quality Support Group, Inc. • What is on your mind? • Do you have any questions? • What have you tried? • Worked or not? Why? • Your feedback and engagement
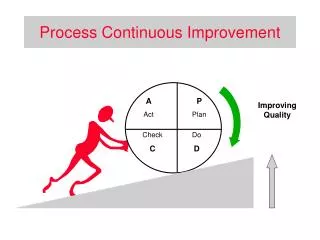
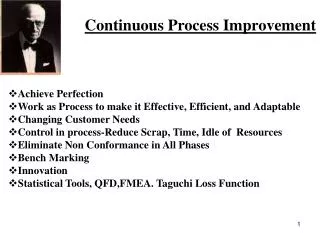
QSG QSG Quality Support Group, Inc. Continuous Improvement Vision / Definition Continuous Improvement is the relentless effort of top management to seek out and eliminate waste at all levels of the organization. This is achieved through a sustained, results oriented process to instill this culture changing mindset into all levels of the organization through leadership, tools and training.
QSG QSG Quality Support Group, Inc. Continuous Improvement Vision / Definition Align your QMS with the achievement of organizational and business success.
Cost Of Poor Quality • Revenues • -(Cost of Operations) • (Cost of Poor Quality) • (Cost Recovery) • Profits
COQ = IF + AP + PC + EF TMC COQ = Cost of Quality IF = Internal Failure AP = Appraisal PC = Prevention Cost EF = External Failure TMC = Total Mfg. Cost Cost of Quality - Definition Internal Failure (IF) Appraisal (AP) • Scrap • Rework • Supplier Scrap/Rework • Audits • Equipment Maintenance • Inspection • Testing Prevention (PC) External Failure (EF) • Customer Cost • Warranty Cost • Returned Material • Customer Service/Complaints • Quality Planning • Training • Process Control • Process Planning
We have only hit the tip of the iceberg, ECNs Inspection Premium Freight Rework Excess Inventory Morale Floor Space There is much more to capture !! Warranty Lost clients
QSG QSG Quality Support Group, Inc. Business Excellence Model
Business Excellence Model IMPACT ON SOCIETY Policy & Strategy Customer & Market Focus CUSTOMER SATISFACTION ORGANIZATIONAL RESULTS PROCESSES LEADERSHIP PEOPLE SATISFACTION People Management SUPPLIER & PARTNERSHIP PERFORMANCE Resource & Info Management ENABLERS RESULTS
Continual Improvement of the Quality ManagementSystem Management Responsibility Measurement, Analysis, Improvement Satisfaction Resource Management CUSTOMER CUSTOMER Requirements Product Realization Product The ISO Model Outputs Inputs
QSG QSG Quality Support Group, Inc. The new ISO 9001:2008 requirements demand that a company: • understand its operations as a series of linked, interactive processes • manage each process by allocating resources, defining methods and criteria for monitoring and improvement • taking action when a process fails to meet expectations.
Effectiveness Extent to which planned activities are realized and planned results achieved. ISO 9000:2000 3.2.14
Improvement and Effectiveness Top Management shall ensure that the quality policy includes a commitment to comply with requirements and continually improve the effectiveness of the quality management system. ISO 9001: 2008 5.3 The organization shall continually improve the effectiveness of the quality management system through the use of the quality policy, quality objectives, audit results, analysis of data, corrective and preventive actions and management review. ISO 9001: 2008 8.5
Process Flow Chart t n e m e Continual Improvement g Management Internal a Corrective Actions n Review Audit a Preventive Actions M Assembly, d Customer Ship to Inquiry & Quote e Design Purchasing Inspection, t n Review Customer (Design Feasibility) e s and Test i e r s o s - e r c e o Customer Yes No m r NDA? P o Property t s u C Supplies t Development r o Calibration p p Document Quality u Training S Control Records
PROCESS MAP FOR PRODUCTION Inputs/Materials (With what?) Demand Parts Equipment Computers Facility Measures (Trend Charts) Defect Per Million Productivity OTD to Customers Outputs Products Transactions Production Process (Major Elements & Boundaries) *Start- 1. Production schedule 2. Verify Work Instructions 3. Perform machine set-up(s) 4. Material Prep 5. Build and verify first piece 6. Build lot 7. Final product audit *End- 8. Transact to Non-netable Limbo Process Owners: Cell Administrators Suppliers (By whom?) Cell Administrator Cell Leader M. Q. Engineer Material Handler Asemblers Set-Up Technician Customers (For whom?) Shipping Customer Service External Customers Methods (How?) Work Instructions Training Non-conforming Material Preventive Maintenance Calibration Documentation Control Records (test results) Skills/Training & Competency (Of whom?) Qualifications (Job Descriptions) PFP for Salaried Skills matrix for direct labor Ergonomic/Safety Policies and Procedures
4 Panel Report - Example Pane 1 – Where are we? Pane 2 – Why are we here? 6.00% $350,000.00 5.00% $300,000.00 4.00% $250,000.00 Percentage of Paid Shipments with Exception 3.00% $200,000.00 2.00% $150,000.00 $100,000.00 1.00% $50,000.00 0.00% July FY06 Aug FY06 April FY06 May FY06 June FY06 March FY05 $0.00 October FY05 January FY05 February FY05 November FY05 December FY05 September FY05 1 2 3 4 5 6 7 8 9 Month Pane 3 – How did we get here? Pane 4 – What do we do now? Run Chart Data Exceptions by Month Action Plan Action Resp Date Comment Month Paid shipments # Exceptions Exceptions Goal September FY05 886 43 4.85% 2.50% October FY05 1139 32 2.81% 2.50% November FY05 1103 45 4.08% 2.50% December FY05 1346 48 3.57% 2.50% January FY05 993 38 3.83% 2.50% February FY05 856 36 4.21% 2.50% March FY05 1056 44 4.17% 2.50% April FY06 923 33 3.58% 2.50% May FY06 877 13 1.48% 2.50% June FY06 891 14 1.57% 2.50% July FY06 779 9 1.16% 2.50% Aug FY06 923 7 0.76% 2.50%
The QSG Model In the following example, an organization has identified several quality objectives and has collected data on the results of these objectives. Using a gap analysis technique, the results are compared to the objectives and the degree of effectiveness of the QMS is established for a given time period.
Organizational Objectives Customer requirements Statutory & regulatory requirements Defect rate and customer returns QMS controls Purchasing Analysis of Data Organizational Results Customer satisfaction Statutory & regulatory compliance Quality system metrics Examples of results recorded by the Organization Inspection and test Supplier performance
100 100 0 0 Effectiveness of the QMS Organizational Objectives Organizational Results The gap measures the lack of effectiveness of the quality management system. The narrower the gap, the more effective the QMS. Things are looking good!
100 100 0 0 Effectiveness of the QMS Organizational Objectives Organizational Results The gap measures the lack of effectiveness of the quality management system. Management should get a wake up warning!
100 100 0 0 Effectiveness of the QMS Organizational Objectives Organizational Results The gap measures the lack of effectiveness of the quality management system. The Organization is in trouble!
Improvement in the QMS % 100 75 50 25 0 Improvement in the QMS Organizational Objectives Organizational Results
These actions may cause the organization to revise its objectives. Improvement in the QMS Organizational Objectives Organizational Results Improvement Initiatives What actions are taken when gaps are identified? Customer Focus Corrective Action In this example, the organization identified three key areas for improvement. Procurement
100 100 Organizational Objectives Organizational Results Improvement Initiatives 0 0 Customer Focus Management Review Corrective Action Procurement Management Review The improvement processes are also evaluated during management review meetings and appropriate action taken. Which may cause the organization to again revise its objectives.
Conclusion The overall result of using the QSG model is an enhanced pro-active approach to meet QMS objectives and more importantly their related corporate business and/or financial objectives. The effectiveness of the quality management system in meeting both quality and/or business objectives is likely to be the key attribute that ensures the on-going support and resource allocation to maintain the quality management system within the corporate environment.
QSG QSG Quality Support Group, Inc. THANK YOU! Angelo G. Scangas President Quality Support Group, Inc. 978-430-7611 WWW.QUALITYSUPPORTGROUP.COM