Download
1 / 15
160 likes | 397 Views
?. ?. What is the Demographic Transition Model?. Starter: Write down definitions for these terms: Birth Rate Death Rate Infant mortality Dense Sparse. ?. BY THE END OF THIS LESSON YOU WILL BE ABLE TO EXPLAIN TO ME EXACTLY WHAT THIS IS AND HOW IT WORKS. ?. ?.

E N D
? ? What is the Demographic Transition Model? Starter: Write down definitions for these terms: Birth Rate Death Rate Infant mortality Dense Sparse ? BY THE END OF THIS LESSON YOU WILL BE ABLE TO EXPLAIN TO ME EXACTLY WHAT THIS IS AND HOW IT WORKS. ? ?
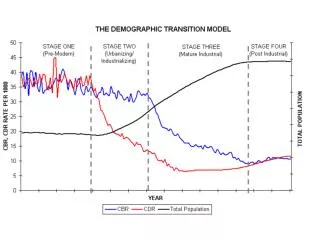
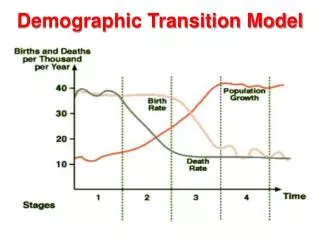
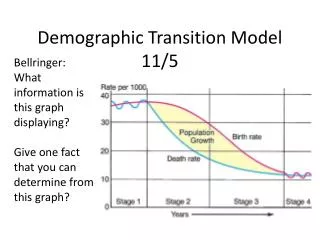
Challenge-follow the instructions in your pair and create your own DTM-these will be compared and checked at the end • You need 3 different coloured pens to create a key for: Birth rate, death rate, total population • Draw an x-y graph structure. • Along the x axis- divide it into 5 equal vertical sections with a dotted line and number them stage 1 to 5. • Label the y axis ‘Birth and death rates (per 1,000 of the population)’ and x axis time • NOW TIME TO THINK- you must draw lines as is described in each stage and use your initiative for any omitted information…. • Stage 1- there is a high birth rate and high death rate that fluctuates. There is a low total population. • Stage 2- the health care and sanitation has improved. The birth rate remains the same. (what is happening to the population?) • Stage 3- there’s a decreased desire for large families and increased access to contraception. Death rate continues to fall. (what is happening to the population?) • Stage 4- birth rate and death rate remain low but fluctuating. (what is happening to the population?) • Stage 5- there are very few babies being born and the population is decreasing. (what is happening to the death rate?) • Using these labels- decide which goes with each stage: late expanding, recession, early expanding, low fluctuating, high fluctuating • Real life situations: Put these situations into the correct location along your DTM a) latex condoms become available b) penicillin invented c) factories ban child labour d) women have children later in life e) families are large so children can work in the fields f) clean water widely available g) post-war baby boom generation
Demographic transition Model • Draw your own accurate DTM large in the middle of a double page spread Page 234 helps a) latex condoms become available b) penicillin invented c) factories ban child labour d) women have children later in life e) families are large so children can work in the fields f) clean water widely available g) post-war baby boom generation
On your DTM you must now annotate it with: • Reasons why the DR and BR change at each stage • Countries at this stage • When the UK went through the stage • DO NOT JUST COPY FROM THE TEXT BOOK!
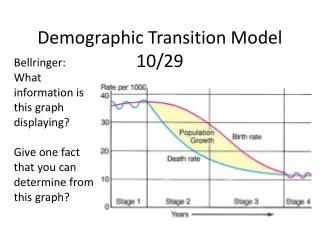
What is the Demographic Transition Model? Birth Rates Death Rates Total Population
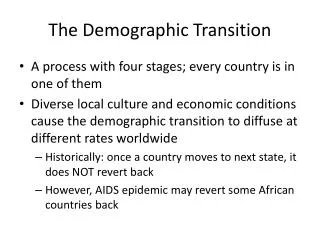
Questions- answer in FULL sentences: Using page 232 and 233 How are birth and death rates effected by scientific/medical influences? How are birth and death rates effected by economic influences? How are birth and death rates effected by social and political influences? Do you think that every single country goes through the different stages in exactly the same way as the model shows? (THINK ABOUT TIME, HISTORY, POLITICAL AND CULTURE) Explain your answer. Why do you think that stage 5 has been added on at a later date? What are population pyramids? Page 246 Draw population pyramids that would fit with each stage of the DTM Answer questions
Questions –using your own knowledge and the information from the text • Write a definition for: Birth rate, death rate, child mortality, immunisation, • How much did the number of children dying before the age of 5 fall between 1990 and 2020? • Name 3 countries in Sub Saharan Africa. Why do you think it has the highest child mortality? • What has reduced the Death Rate across the world? • How and why did Niger’s child mortality rate fall? • Why is Somalia’s Death Rate predicted to get worse? Use 3 bits of evidence/date in your answer? • How would Somalia’s population pyramid change as a result of this? • Describe and explain where you would put Somalia and Niger on the Demographic Transition model. • Explain why governments are trying to reduce child mortality. (THINK: social and economic) • Summarise the article in 140 characters (twitter length)