Download
1 / 23
230 likes | 339 Views
8 th BITRE Transport Colloquium Australian Transport – building capacity and competitiveness. Session 8: Climate change and Australia's international transport links—aviation and maritime challenges. Parliament House Canberra. David Cosgrove. 18-19 June 2008.

E N D
8thBITRE Transport ColloquiumAustralian Transport – building capacity and competitiveness Session 8: Climate change and Australia's international transport links—aviation and maritime challenges Parliament House Canberra David Cosgrove 18-19 June 2008
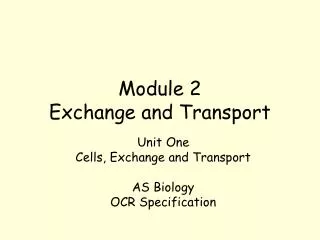
Steadily increasing passenger and freight tasks • Steadily increasing transport energy use Sources: BITRE estimates – for domestic transport, ABARE fuel consumption data – for domestic sales.
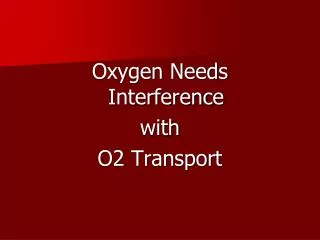
Total Australian Passenger Task, 1945 - 2007 Sources: BTRE (2006), BITRE (2008), BITRE estimates
Total Australian Passenger Task, 1945 - 2007 Sources: BTRE (2006), BITRE (2008), BITRE estimates
Total Australian Passenger Task, 1945 - 2007 Sources: BTRE (2006), BITRE (2008), BITRE estimates
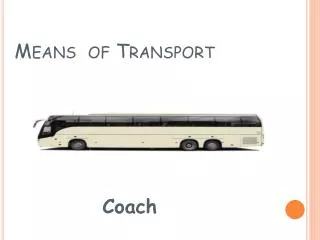
Total Australian Freight Task, 1945 - 2007 Sources: BTRE (2006), BITRE (2008), BITRE estimates
Total Australian Freight Task, 1945 - 2007 Sources: BTRE (2006), BITRE (2008), BITRE estimates
Total Australian Freight Task, 1945 - 2007 Including here, for demonstration purposes, both total exports and imports for Australian trade. Even though this would result in double-counting, if totalled across different nations, there is not yet any agreed framework for consistently allocating portions of aggregate international tasks to particular countries. Sources: BTRE (2006), BITRE (2008), BITRE estimates
Total Australian Freight Task, 1945 - 2007 Note that if only Australian imports were included here, the international tonne-km values would be much lower (by about a factor of 8 for current task levels). Sources: BTRE (2006), BITRE (2008), BITRE estimates
International transport, CO2 emission projections Global (smoothed) expected trends Based on UN/IMO projected trends Based on ICAO projected trends Sources: BITRE estimates based on ICAO, IMO and IEA data
Total Australian Passenger Task Projections Base case projections Sources: BTRE (2006), BITRE (2008), BITRE estimates
Total Australian Freight Task Projections Base case projections Sources: BTRE (2006), BITRE (2008), BITRE estimates
Total Energy End-use by Australian Transport Allows for international aviation and shipping to and from Australia (allocating half of their total fuel use; as an example of one method for avoiding double-counting of global emissions, when totalling across different countries). Base case projections Sources: ABARE (2008, website data release), Apelbaum (2007), Department of Resources, Energy and Tourism (2008, fuel sales data), BTRE (2006), BITRE (2008), BITRE estimates.
Total Greenhouse Contribution of Australian Transport Emissions for international transport, to and from Australia, are estimated using half of total fuel use. Base case projections Note: total warming effects - includes both directly radiative gases and indirectly radiative gases. Sources: BTRE (2006), BITRE (2008), BITRE estimates
Full greenhouse contribution of Australian transport Source: BITRE (2008)
Full greenhouse contribution of Australian transport ‘Global Warming Potential’ values for short-lived gases only approximate Source: BITRE (2008)
Full greenhouse contribution of Australian transport Re-allocating emissions from the ‘Energy transformation’ sector of the National Greenhouse Gas Inventory GWP values for short-lived gases only approximate Source: BITRE (2008)
Full greenhouse contribution of Australian transport Re-attributing emissions from the ‘Industrial Processes’ sector of the National Greenhouse Gas Inventory Re-allocating emissions from ‘Energy transformation’ GWP values for short-lived gases only approximate Source: BITRE (2008)
Full greenhouse contribution of Australian transport Known to have an effect – but not yet fully quantified Re-attributing emissions from the ‘Industrial Processes’ sector of the National Greenhouse Gas Inventory Re-allocating emissions from ‘Energy transformation’ GWP values for short-lived gases only approximate Source: BITRE (2008)
Full greenhouse contribution of Australian transport International civil transport to and from Australia (using a rough allocation of half total fuel use) currently adds around 28% to the total for domestic civil transport International Transport Domestic Transport Source: BITRE (2008)
Full greenhouse contribution of Australian transport It is important to consider all sources and all gases when estimating total warming effects – especially for aviation, due to high-altitude effects for some non-CO2 emissions International Transport Domestic Transport Source: BITRE (2008)
References and further reading, from the BITRE website: • BTRE (2002), Greenhouse Gas Emissions From Transport: Australian Trends To 2020, Report 107http://www.bitre.gov.au/publications/93/Files/r107.pdf • BTRE (2006), Greenhouse Gas Emissions from Australian Transport: Base Case Projections To 2020, Report to AGOhttp://www.bitre.gov.au/info.aspx?NodeId=16 • BTCE (1996), Transport and Greenhouse: Costs and options for reducing emissions, Report 94 • Cosgrove, D. C. (2003), Urban Pollutant Emissions from Motor Vehicles: Australian Trends to 2020, Final Draft Report for Environment Australia, BTRE 2003http://www.bitre.gov.au/publications/36/Files/ea_btre.pdf • BITRE (2008, forthcoming Working Paper), Greenhouse Gas Emissions from Australian Transport – 2007: Projections to 2020 http://www.bitre.gov.au/
David Cosgrove Climate change and Australia's international transport www.transportcolloquium.com.au