Download
1 / 1
10 likes | 150 Views
Effects of Road Construction on Nearby Trees Conor Madison Natural Resources, Environmental Science Dr. Rock and Dr. Carlson University of New Hampshire, Durham, NH conormadison9@gmail.com. Abstract. Results.

E N D
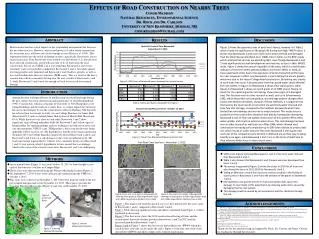
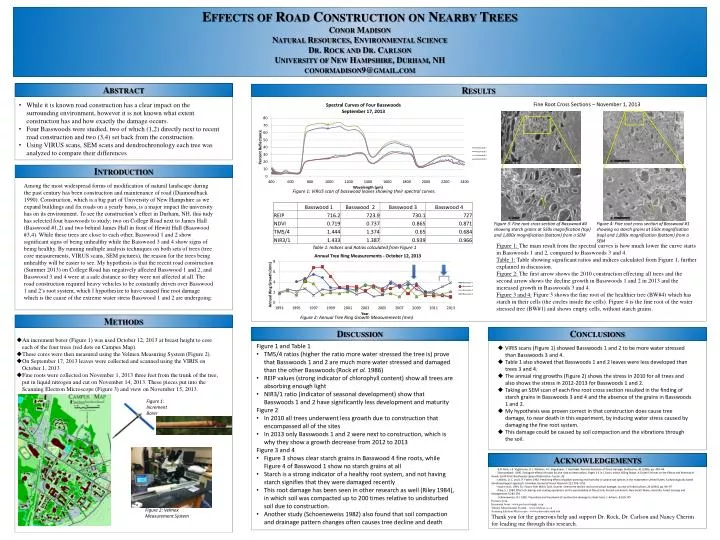
Effects of Road Construction on Nearby Trees Conor Madison Natural Resources, Environmental Science Dr. Rock and Dr. Carlson University of New Hampshire, Durham, NH conormadison9@gmail.com Abstract Results • While it is known road construction has a clear impact on the surrounding environment, however it is not known what extent construction has and how exactly the damage occurs. • Four Basswoods were studied, two of which (1,2) directly next to recent road construction and two (3,4) set back from the construction. • Using VIRUS scans, SEM scans and dendrochronology each tree was analyzed to compare their differences Fine Root Cross Sections – November 1, 2013 Introduction Among the most widespread forms of modification of natural landscape during the past century has been construction and maintenance of road (Diamondback 1990). Construction, which is a big part of University of New Hampshire as we expand buildings and fix roads on a yearly basis, is a major impact the university has on its environment. To see the construction’s effect in Durham, NH, this tudy has selected four basswoods to study; two on College Road next to James Hall (Basswood #1,2) and two behind James Hall in front of Hewitt Hall (Basswood #3,4). While these trees are close to each other, Basswood 1 and 2 show significant signs of being unhealthy while the Basswood 3 and 4 show signs of being healthy. By running multiple analysis techniques on both sets of trees (tree core measurements, VIRUS scans, SEM pictures), the reason for the trees being unhealthy will be easier to see. My hypothesis is that the recent road construction (Summer 2013) on College Road has negatively affected Basswood 1 and 2, and Basswood 3 and 4 were at a safe distance so they were not affected at all. The road construction required heavy vehicles to be constantly driven over Basswood 1 and 2’s root system, which I hypothesize to have caused fine root damage which is the cause of the extreme water stress Basswood 1 and 2 are undergoing. Figure 1: VIRUS scan of basswood leaves showing their spectral curves. Figure 3: Fine root cross section of Basswood #4 showing starch grains at 550x magnification (top) and 1,800x magnification (bottom) from a SEM Figure 4: Fine root cross section of Basswood #1 showing no starch grains at 550x magnification (top) and 1,800x magnification (bottom) from a SEM Figure 1: The main result from the spectral curves is how much lower the curve starts in Basswoods 1 and 2, compared to Basswoods 3 and 4. Table 1: Table showing significant ratios and indices calculated from Figure 1, further explained in discussion. Figure 2: The first arrow shows the 2010 construction effecting all trees and the second arrow shows the decline growth in Basswoods 1 and 2 in 2013 and the increased growth in Basswoods 3 and 4. Figure 3 and 4: Figure 3 shows the fine root of the healthier tree (BW#4) which has starch in their cells (the circles inside the cells). Figure 4 is the fine root of the water stressed tree (BW#1) and shows empty cells, without starch grains. Table 1: Indices and Ratios calculated from Figure 1 Figure 2: Annual Tree Ring Growth Measurements (mm) Methods Discussion Conclusions • An increment borer (Figure 1) was used October 12, 2013 at breast height to core each of the four trees (red dots on Campus Map). • These cores were then measured using the Velmex Measuring System (Figure 2). • On September 17, 2013 leaves were collected and scanned using the VIRIS on October 1, 2013. • Fine roots were collected on November 1, 2013 three feet from the trunk of the tree, put in liquid nitrogen and cut on November 14, 2013. These pieces put into the Scanning Electron Microscope (Figure 3) and view on November 15, 2013. • Figure 1 and Table 1 • TM5/4 ratios (higher the ratio more water stressed the tree is) prove that Basswoods 1 and 2 are much more water stressed and damaged than the other Basswoods (Rock et al. 1986) • REIP values (strong indicator of chlorophyll content) show all trees are absorbing enough light • NIR3/1 ratio (indicator of seasonal development) show that Basswoods 1 and 2 have significantly less development and maturity • Figure 2 • In 2010 all trees underwent less growth due to construction that encompassed all of the sites • In 2013 only Basswoods 1 and 2 were next to construction, which is why they show a growth decrease from 2012 to 2013 • Figure 3 and 4 • Figure 3 shows clear starch grains in Basswood 4 fine roots, while Figure 4 of Basswood 1 show no starch grains at all • Starch is a strong indicator of a healthy root system, and not having starch signifies that they were damaged recently • This root damage has been seen in other research as well (Riley 1984), in which soil was compacted up to 200 times relative to undisturbed soil due to construction. • Another study (Schoeneweiss 1982) also found that soil compaction and drainage pattern changes often causes tree decline and death • VIRIS scans (Figure 1) showed Basswoods 1 and 2 to be more water stressed than Basswoods 3 and 4. • Table 1 also showed that Basswoods 1 and 2 leaves were less developed than trees 3 and 4. • The annual ring growths (Figure 2) shows the stress in 2010 for all trees and also shows the stress in 2012-2013 for Basswoods 1 and 2. • Taking an SEM scan of each fine root cross section resulted in the finding of starch grains in Basswoods 3 and 4 and the absence of the grains in Basswoods 1 and 2. • My hypothesis was proven correct in that construction does cause tree damage, to near death in this experiment, by inducing water stress caused by damaging the fine root system. • This damage could be caused by soil compaction and the vibrations through the soil. Figure 1: Increment Borer - B.N. Rock, J.E. Vogelmann, D.L. Williams, A.F. Vogelmann, T. Hoshizaki. Remote detection of forestdamage. BioScience, 36 (1986), pp. 439–44. - Diamondback. 1990. Ecological effects of roads (or, the road to destruction). Pages 1-5 in J. Davis, editor. Killing Roads: A Citizen’s Primer on the Effects and Removal of Roads. Earth First! Biodiversity Special Publication, Tuscon, AZ. - LeBlanc, D. C. and J. R. Foster. 1992. Predicting effects of global warming and mortality of upland oak species in the midwestern United States: A physiologically based dendroecological approach. Canadian Journal of Forest Research 22:1739–1752. - Hauer et al., 1994. R.J. Hauer, R.W. Miller, D.M. Ouimet. Street treedecline and constructiondamage. Journal of Arboriculture, 20 (1994), pp. 94–97 - Riley, S.J. 1984. Effect of clearing and roading operations on the permeability of forest soils, Karuah catchment, New South Wales, Australia. Forest Ecology and Management 9:283-293. - Schoeneweiss, D.F. 1982. Prevention and treatment of construction damage to shade trees. J. Arboric. 8:169-175 Pictures from - Increment borer –www.pacforestsupply.com VelmexMeasurement System – www.trl.ibcas.ac.cn Scanning Electron Microscope - www.nanocenter.umd.edu Thank you for the generous help and support Dr. Rock, Dr. Carlson and Nancy Cherim for leading me through this research. Acknowledgements Figure 2: Velmex Measurement System