Download
1 / 6
60 likes | 135 Views
2-8 Misleading Statistics pages 92-95. Standards: D-1,2,3,4,&6. Misleading Statistics.

E N D
2-8 Misleading Statisticspages 92-95 Standards: D-1,2,3,4,&6
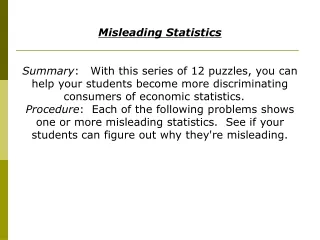
Misleading Statistics Statistics and graphs can be presented in ways that are misleading. For example, the mean is not a good way to describe a data set when there are outliers. Changing the scale of the graph may also make the graph misleading.
Example Darnell was notified that the raffle ticket he bought at the county fair was a winner. He was told that the average prize amount was $4,000. Use the information in the given table to explain why Darnell should not expect to win more than $100. There are only three prizes over $100, and 50 prizes of $100. Because of the large number of $100 prizes, Darnell is most likely to win only $100.
Try this… Abigail’s starting salary was $47,000, three years ago. She received a $2,000 raise each year. Create a graph that makes her salary look more substantial that they actually are.
Try this too…. • The two line graphs show sales of T-shirts at The Tee Shop for May. Which graph could be misleading? Explain why. Graph B, because the vertical axis starts at 55 instead of zero. It makes it look like sales increased more than they actually did.
More Practice… The Italian Restaurant advertises huge meals. The sizes of many of their meals are shown in the given table. What misleading statistics might they be using to describe the serving sizes of their meals? A. mean B. median C. mode D. distorted facts