Download

1 / 18
180 likes | 509 Views
The Demography of the Arab World. Jane Diamond ST203, 21.10.02. The Arab World. Overview of Lecture Demographic Trends Major factors influencing demographic trends Case Study: The Palestinians. Categorisation of Arab World Demography.

E N D
The Demography of the Arab World Jane Diamond ST203, 21.10.02
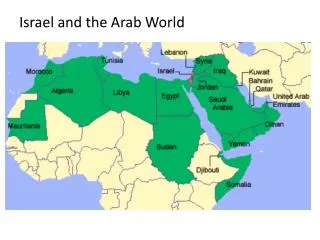
The Arab World • Overview of Lecture • Demographic Trends • Major factors influencing demographic trends • Case Study: The Palestinians
Categorisation of Arab World Demography • I: High fertility; declining mortality with intermediate to low socio-economic settings • Jordan, Oman, Syria, Yemen, West Bank, Gaza • II: Declining fertility and mortality rates in an intermediate level of socio-economic development • Egypt, Lebanon, Turkey, Iran • III: The Gulf States: high fertility amid rapidly declining mortality in a high socio-economic setting • Bahrain, Iraq, Kuwait, Qatar, Saudi Arabia, UAE • IV: low fertility and mortality in an above average socio-economic setting • Israel
Demographic Trends • It took until 1950 for the population of North Africa and the Middle East to reach 100 million. The second 100 million took only 30 years! • Current Doubling Times (in years) • Egypt 35 • Morocco 41 • Gaza Strip 16 • West Bank 21 • Yemen 24 • Oman 18 • Saudi Arabia 23 • UK 423 • Spain 1,980 • (Sources, Population Reference Bureau, 1999)
Population Momentum • Percentage of Population Under Age 15 • Yemen 47 • Gaza 50 • West Bank 45 • Syria 42 • Oman 46 • Iraq 43
Life Expectancy (Years) 1960 2002 Afghanistan 33 45 Yemen 37 59 Iraq 50 58 Iran 51 61 Jordan 48 70 Morocco 48 69 Oman 41 73 Egypt 47 66
Health Indicators Percentage of population with access to health services (1985-95) Total Urban Rural Afghanistan 29 80 17 Yemen 38 81 32 Morocco 70 100 50 Egypt 99 100 99 Oman 96 100 94
Infant Mortality RatesDeaths per 1000 Live Births 1960 1994 2002 Yemen 230 78 75 Morocco 133 56 50 Iran 145 40 32 Egypt 169 51 44 Oman 180 22 17 UAE 160 21 19 Israel 32 7 5.3 Iraq 117 57 103
Maternal Mortality RatePer 100,000 Live Births, 2001 Afghanistan 1700 Iraq 310 Egypt 170 Morocco 610 Yemen 1600 Syria 180 Saudi Arabia 130 UAE 26 Lebanon 300 Oman 190 Libya 220 Israel 7
Primary Causes of Maternal Mortality in the Arab World • Poor quality services • Culture • Lack of education • Limited autonomy of women • Early marriage • High fertility • Late childbearing
Childbearing and Contraceptive Use (2002) TFR CPR (All) CPR(Modern) Yemen 7.2 21 10 Iraq 5.4 18 10 Oman 4.7 24 18 Qatar 3.9 43 32 Egypt 3.5 48 41 Libya 3.7 45 26 Palestine 5.9 51 37
Migration and the Arab Region • Four Key Migration Streams • Emigration from the Mediterranean to Western Europe • Arab labour migration to oil-producing states • Arab labour migration to non-oil producing states • East and South Asian labour migration to oil producing states • Migrant labour characterised by extraordinary deprivation of basic rights
Refugees • Major Flows to Iran and Turkey • Mass immigration for settlement in Israel • The Palestinians
Case Study: The Palestinians • By 1997, 3.7 million Palestinians registered as refugees • ‘the paradox of mobility and insecurity…exiles at home as well as abroad…’ Said (1986)
The Palestinians: Demographic and Health Indicators Gaza West Bank Population (million) 1.2 1.9 No Refugees (1994) 363,000 500,000 Pop Under 15 (%) 60 49 % females under 15 45 44 CPR 25 34 TFR 5.9 Doubling Time 16 21 Desired Family Size 5 n/k % living 7+per room 44 42
Palestinian Internal Migrant Labour Patterns • Palestinian residents of the territories occupied by Israel in 1967 war. • Israeli Labour market opened up to workers from Gaza and West Bank but conditions poor and exploitation rife. • Palestinians found jobs in • Construction • Agriculture • Hotels/restaurants • Domestic Service • By 1984, 87,000 Palestinians employed in Israel – about 36% of total workforce of Occupied Territories
The Intifadah • Israelis aimed at weakening uprising. • Result – sharp decline in employment of Palestinians from 1991. • Workers from Romania and Thailand recruited to replace Palestinian workers from West Bank and Gaza Strip.
Reproductive Health in PalestineCulture and Conflict • Women’s reproductive and sexual health rarely discussed openly • Girls and young women increasingly risk illiteracy and school dropout – a trend affected by the intifadah and conflict. • Due to intifadah families are marrying their daughters at a younger age – security. • Societal preference for larger families to begin childbearing early – status often defined by number of children • Variable quality of reproductive health services • Significant proportion of women marry first or second cousin. • Rape is not discussed – a woman might be married off to a cousin to keep a secret in the family. • Intifadah – access – affordability.