Download
1 / 88
880 likes | 1.04k Views
From Dirt to Disposition Transaction Power Tools. Colin Fox, CCIM www.colinfox.com. Transaction Objective. Analyze and Sell a 115,297 SqFt Class A Office Building located in the NASA Clear Lake submarket of Houston, TX. Power Tools. The CCIM Professional. Part 1 – CCIM Education.

E N D
From Dirt to Disposition Transaction Power Tools Colin Fox, CCIM www.colinfox.com
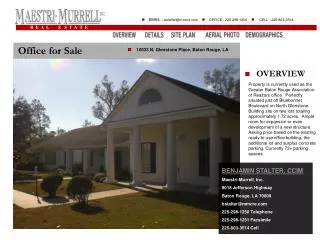
Transaction Objective Analyze and Sell a 115,297 SqFt Class A Office Building located in the NASA Clear Lake submarket of Houston, TX
The CCIM Professional Part 1 – CCIM Education CCIM Designation - A Certified Commercial Investment Member (CCIM) is a recognized expert in the disciplines of commercial and investment real estate. The CCIM Institute is an affiliate of NAR, the largest trade association in the world.
The CCIM Professional Part 1 - CCIM Education The CCIM Professional “Until I went through CCIM training, I didn’t know what I didn’t know.”
Investment Real EstateEducation • Introduction to Commercial Investment Real state Analysis • Financial Analysis 101 • Market Analysis 102 • User Decision Analysis 103 • Investment Analysis 104
Global Influence of CCIM Education • Over 180 Course Offerings Annually • Primary and Secondary Markets • 7,000 Students • 30 Countries • Three Continents • 20% of New Designees are International
The Makingof a CCIM • 200 Classroom Hours • Portfolio of Transactions $$$$ • Elective Credits • 8-hour Comprehensive Exam
CCIM – The Green Factor CCIM members conduct more than $400 billion in transactions annually.
CCIM Profile $400 Billionannually
Knowledge is Power – Francis Bacon • Updated Course Material • Publications and Articles • Specialty Chat Rooms • Financing Rate Sheets and Resourses • Google like Search Engine Coming Soon - Knowledge Management System
Part 2 – Site Analysis The real estate industry has always known geography matters—after all, real estate practitioners coined the phrase "location, location, location."
Introducing CCIM’s STDB (Site To Do Business) Power Tools • These tools provide an integrated system offering: • Mapping Tools • Demographics • Property Residual Demand Analysis • Business Lists
Mapping Tools – The Power of GIS A Geographic Information System (GIS) is a set of computerized tools (including both hardware and software) for collecting, storing, retrieving, transforming, and displaying spatial data. GIS is essentially a marriage between computerized mapping and database management systems.
Better Business Decisions GIS intelligence systems bring marketing analysis tools and demographic data products together to offer powerful ways to compete in today's business strategies. GIS provides essential marketing and customer intelligence solutions that lead to better business decisions.
Understanding the Data with GIS One of the most important methods of evaluating the present and future value of real estate requires analyzing underlying population and economic factors. To help clients easily visualize demographic and economic data, we can now use a GIS format that provides demographic thematically colored maps that may include additional information such as retail consumer spending and traffic counts. Site specific areas can be studied using circles, polygons or drive-times.
Getting the Picture with GIS Simply stated: Think of GIS as a powerful presentation tool. A GIS creates high quality maps that communicate considerable amounts of information in an efficient and attention-getting manner. "A picture is worth a thousand words."
Aerial Photographs provided byGoogle (Orthorectified & Geocoded)
High Impact Value of GIS Example of the high impact value of GIS involving a landfill environmental problem using ESRI ArcScene and ArcGIS 3D Analyst Please pause for the video to start
CCIMNet – Property Flyover Please pause for video to start
Development Planning with GIS Interactive solution for office and retail selection
Demographics These tools allow an analyst to easily: • Compare market areas • Analyze competition • Provide sophisticated exhibits for use in appraisal and consulting assignments.
Where does the data come from? • Applied Geographic Solutions provides the majority of data from the 2000 Census and retains a core variable set from the 1990, 1980 and 1970 Census.
Getting Started – Selecting Geography The next several slides depict screen shots from the STDB. The selecting of geography is the first step in obtaining demographics.
Types of Geographies – Counties/Boroughs Juneau, Alaska
Types of Geographies – US Cities Woonsocket, RI
Types of Geographies – Census Tracts 1,000 – 8,000 people (4,000 people ideal)
Types of Geographies – Block Groups 300 – 3,000 people (1,500 people ideal)
Types of Geographies – Radii Data from 1-3 miles around center Data from 0 to 1 mile from center Data from 0 to 5 miles from center
Demographics Reports • Comprehensive Demographics (±9500 variables) • Numerous Geographical Areas • Summary, Comparison, and Ranking Reports (Customizable)
Demographic Express Packages To make life easier STDB has created site analysis express package templates for the following property types: • Office • Industrial • Multi-Family • Senior Housing / Single Family • Self-Storage • Retail • Hotel / Motel • Note: Templates are customizable
Office Express Package This package contains 13 reports, including 7 maps: • Executive Demographic • Business Summary • Demographic Snapshot • Household Detail • Income • Population & Education • MOSAIC Summary with Chart Maps Reports: • 2004 Employee Density Map • 2004 Median Household Income Map • 2004 Owner Occupied Units Map • 2004 Population Density Map • 2009 Average Household Income Map • 2009 Population Density Map
Office Express Package Executive Demographic Report The current year population in this selected geography is 135,349. The 2000 Census revealed a population of 123,659, and in 1990 it was 88,807 representing a 39.24% change. It is estimated that the population in this area will be 149,251 in 2009, representing a change of 10.27% from 2004. The current population is 50.46% male and 49.54% female. In 2004, the median age of the population in this area was 35.4, compared to the MSA_3360 median age which was 32.8. The population density in your area is 1,723.3 people per square mile.
Office Express Package Business Summary Report
Office Express Package Population and Education Report
Office Express Package MOSAIC Summary with Chart
Office Residual Demand Analysis • Look at supply side information from local office market. • Determine demand. • Examine interaction between supply and demand. • Project what net over or under supply will be five years from now. Note: Residual Demand Reports also available for: • Multi-family • Retail • Industrial • Subdivision (Coming Soon) • Single Family (Coming Soon)
Supply Factors Data Source Data based on 1st Quarter 2005 market survey by Colliers International and could vary if another source was used such as CoStar, Cushman and Wakefield, CBRE or Property & Portfolio Research.