Download
1 / 1
10 likes | 85 Views
Searching for massive pre-stellar cores through observations of N 2 H + and N 2 D + (F. Fontani 1 , P. Caselli 2 , A. Crapsi 3 , R. Cesaroni 4 , J. Brand 1 ). 1 INAF-Istituto di Radioastronomia, Bologna (Italy) 2 Harvard-Smithsonian Center for Astrophysics, Boston (USA)

E N D
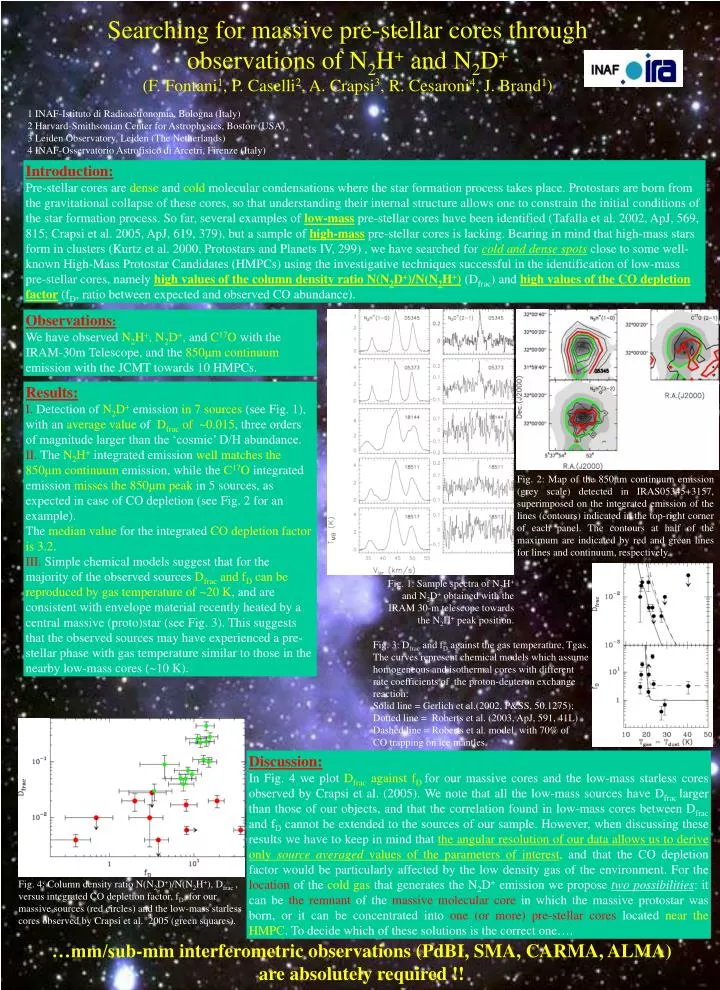
Searching for massive pre-stellar cores through observations of N2H+ and N2D+ (F. Fontani1, P. Caselli2, A. Crapsi3, R. Cesaroni4, J. Brand1) 1 INAF-Istituto di Radioastronomia, Bologna (Italy) 2 Harvard-Smithsonian Center for Astrophysics, Boston (USA) 3 Leiden Observatory, Leiden (The Netherlands) 4 INAF-Osservatorio Astrofisico di Arcetri, Firenze (Italy) Introduction: Pre-stellar cores are dense and cold molecular condensations where the star formation process takes place. Protostars are born from the gravitational collapse of these cores, so that understanding their internal structure allows one to constrain the initial conditions of the star formation process. So far, several examples of low-mass pre-stellar cores have been identified (Tafalla et al. 2002, ApJ, 569, 815; Crapsi et al. 2005, ApJ, 619, 379), but a sample of high-mass pre-stellar cores is lacking. Bearing in mind that high-mass stars form in clusters (Kurtz et al. 2000, Protostars and Planets IV, 299) , we have searched for cold and dense spots close to some well-known High-Mass Protostar Candidates (HMPCs) using the investigative techniques successful in the identification of low-mass pre-stellar cores, namely high values of the column density ratio N(N2D+)/N(N2H+) (Dfrac) and high values of the CO depletion factor (fD, ratio between expected and observed CO abundance). Observations: We have observed N2H+, N2D+, and C17O with the IRAM-30m Telescope, and the 850μm continuum emission with the JCMT towards 10 HMPCs. Results: I. Detection of N2D+ emission in 7 sources (see Fig. 1), with an average value of Dfrac of ~0.015, three orders of magnitude larger than the ‘cosmic’ D/H abundance. II. The N2H+ integrated emission well matches the850μm continuum emission, while the C17O integrated emission misses the850μm peak in 5 sources, as expected in case of CO depletion (see Fig. 2 for an example). The median value for the integrated CO depletion factor is 3.2. III. Simple chemical models suggest that for the majority of the observed sources Dfrac and fD can be reproduced by gas temperature of ~20 K, and are consistent with envelope material recently heated by a central massive (proto)star (see Fig. 3). This suggests that the observed sources may have experienced a pre-stellar phase with gas temperature similar to those in the nearby low-mass cores (~10 K). Fig. 2: Map of the 850μm continuum emission (grey scale) detected in IRAS05345+3157, superimposed on the integrated emission of the lines (contours) indicated in the top-right corner of each panel. The contours at half of the maximum are indicated by red and green lines for lines and continuum, respectively. Fig. 1: Sample spectra of N2H+ and N2D+ obtained with the IRAM 30-m telescope towards the N2H+ peak position. Fig. 3: Dfrac and fD against the gas temperature, Tgas. The curves represent chemical models which assume homogeneous and isothermal cores with different rate coefficients of the proton-deuteron exchange reaction: Solid line = Gerlich et al.(2002, P&SS, 50.1275); Dotted line = Roberts et al. (2003, ApJ, 591, 41L) Dashed line = Roberts et al. model with 70% of CO trapping on ice mantles. Discussion: In Fig. 4 we plot Dfrac against fDfor our massive cores and the low-mass starless cores observed by Crapsi et al. (2005).We note that all the low-mass sources have Dfrac larger than those of our objects, and that the correlation found in low-mass cores between Dfrac and fD cannot be extended to the sources of our sample. However, when discussing these results we have to keep in mind that the angular resolution of our data allows us to derive only source averaged values of the parameters of interest, and that the CO depletion factor would be particularly affected by the low density gas of the environment. For the location of the cold gas that generates the N2D+ emission we propose two possibilities: it can be the remnantof themassive molecular core in which the massive protostar was born, or it can be concentrated into one (or more) pre-stellar cores located near the HMPC. To decide which of these solutions is the correct one…. Fig. 4: Column density ratio N(N2D+)/N(N2H+), Dfrac ,versus integrated CO depletion factor, fD, for our massive sources (red circles) and the low-mass starless cores observed by Crapsi et al. 2005 (green squares). …mm/sub-mm interferometric observations (PdBI, SMA, CARMA, ALMA) are absolutely required !!