Download
1 / 17
170 likes | 264 Views
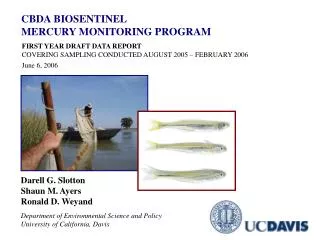
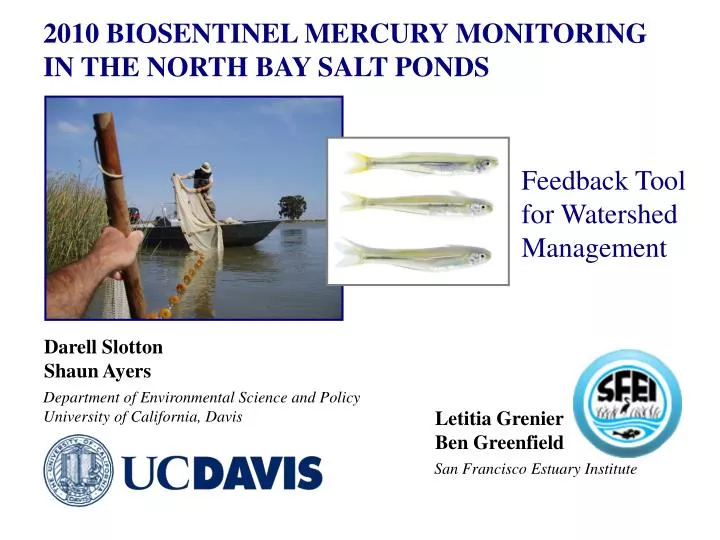
2010 BIOSENTINEL MERCURY MONITORING IN THE NORTH BAY SALT PONDS. Feedback Tool for Watershed Management. Darell Slotton Shaun Ayers. Department of Environmental Science and Policy University of California, Davis. Letitia Grenier Ben Greenfield. San Francisco Estuary Institute.

E N D
2010 BIOSENTINEL MERCURY MONITORING IN THE NORTH BAY SALT PONDS Feedback Tool for Watershed Management Darell Slotton Shaun Ayers Department of Environmental Science and Policy University of California, Davis Letitia Grenier Ben Greenfield San Francisco Estuary Institute
Biosentinel Mercury Monitoring Using small, young fish as localized, time-sensitive, fish based measures of methylmercury exposure • Spatial patterns to a local scale • Year-to-year trends and variability • Within-year seasonal trends • Performance measures for restoration and remediation
UC Davis Delta Silverside Hg • Established clear, regional pattern: elevated periphery, lower central • Silversides ideal biosentinels: widespread; relatively site-specific
North Bay UC Davis / SFEI 2010 Mercury Biosentinel Monitoring • Dec-2009 – Sep-2010 • 30 samplings total Kennedy Park 6 ‘intensive’ seasonal sites: Dec/Mar/May/Jul Petaluma Marsh Wingo Pond 9/10 P 7 Wash ponds Additional one-time sites: July 6A Pond 2 Pond 4/5 Pond 2A Pond 1 Pre-Cullinan Hamilton
Mean Hg ± 95% C.I. 45 ± 2 ng/g Multiple Individual Fish Analyses (n = 30) • Within pre-defined size ranges with consistent Hg • Strong statistical power • Detailed individual information
Feb 7: 100 ± 5 Dec 21: 75 ± 5 Dec 21: 75 ± 5 Oct 18: 43 ± 3 Oct 18: 43 ± 3 Oct 18: 43 ± 3 Oct 6: 44 ± 4 Oct 6: 44 ± 4 Oct 6: 44 ± 4 Oct 6: 44 ± 4 Discharge from seasonally flooded, managed ponds Suisun Marsh Managed Seasonal Flooding: Suisun Slough North, October through February
Clear Creek Ham- ilton City Sacra- mento River Cache Ck Lower Sacramento Series Tuolumne Vernalis San Joaquin River Merced Mud Slough Region UC Davis Biosentinel Monitoring Region: 2005-2007 CBDA Fish Mercury Project • Over 3,000 individual small fish analyses/yr • High precision, high cost
SFEI Compositing Approach: • 4 composites, 4 analyses (vs 30) • 5 fish per composite • 10 mm size increments 1 Comp 40-50 mm 1 Comp 50-60 mm 1 Comp 60-70 mm 1 Comp 70-80 mm • less precise statistics • large cost saving on analytical
Fixed, long-term sites Potential source sites (urban, mines, POTWs) Silverside Additional 1-time sites (12 wetland, 12 bay) Topsmelt Composites (4 comps x 5 fish) SFEI’s 2008-2010 RMP Small Fish Program
Hybrid/Compromise Plan: • 6 composites (vs 4) • 8 fish per composite (vs 5) • Narrower size range (45-75 mm vs 40-80 mm) 1 Comp 55-60 mm 1 Comp 60-65 mm 1 Comp 65-70 mm 1 Comp 70-75 mm 1 Comp 45-50 mm 1 Comp 50-55 mm
2010 Seasonal Silverside Mercury 94 75 46 57 186 Kennedy Park 75 63 138 79 83 65 Petaluma Marsh 55 68 Wingo 78 29 Pond 9/10 96 44 72 85 Wash ponds 54 54 71 46 P 7 68 Pond 2 Pond 4/5 Dec- 2009 66 Mar- 2010 59 63 Pond 1 May 41 Jul Pond 2A
Other species data from sites without silversides (July samplings) Stickleback Killifish Topsmelt juv. Striped Bass 29 24 Silverside 16 53 Pond 7 24 Pond 6A 59 50 42 Pre-Cullinan 88 44 49 Hamilton
North Bay Silverside Mercury Trend, Fall 2005 , Fall 2006 Dec-2009 Pond 2
Silverside Fall 2005 Mercury Spatial Distribution: Entire CBDA Range With Silversides Pond 2
Silverside Means of Comps ± SE Spatial patterns Pond 2
Oct, Feb, May, Jul, Sep, Nov North Bay 2005-2006 Seasonal Silverside Mercury Trend, From Pond 2?
Interim Conclusions from 2010 Work It is possible to use small fish as biosentinels of methylmercury exposure in this region, spatially and seasonally. The lower cost, hybrid compositing approach can provide a reasonable alternative when funding is limited. Significant changes in exposure can occur both seasonally and between sites. Different sites can show different patterns.