Download
1 / 109
1.1k likes | 1.33k Views
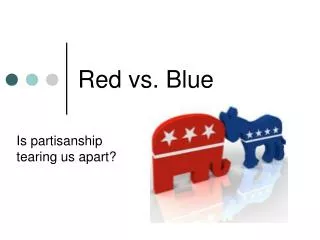
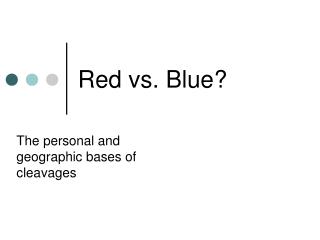
Red vs. Blue?. The personal and geographic bases of cleavages. The map that started it all, 2000 . I. Overview of Fiorina. The “Red vs. Blue” story 50/50 Nation: Americans are split down the middle into Red (pro-Republican) and Blue (pro-Democrat) voters

E N D
Red vs. Blue? The personal and geographic bases of cleavages
I. Overview of Fiorina • The “Red vs. Blue” story • 50/50 Nation: Americans are split down the middle into Red (pro-Republican) and Blue (pro-Democrat) voters • Polarization: The Red/Blue divide has been growing over time • Geographic Divide: Red America is a very different place than Blue America • Partisanship: Partisan bickering has been on the increase
B. Fiorina’s Contribution • 50/50 Nation: Fiorina agrees • Polarization: Fiorina disagrees • Geographic Divide: Fiorina disagrees • Partisanship: Fiorina distinguishes between elite-driven and mass-driven partisanship, argues that elite polarization produces partisan discord among voters
C. Unanswered Questions • Why do some people identify as Republican while others identify as Democrat? • Are there regional divides aside from the mythical Red/Blue one? • Is elite partisanship increasing?
II. The Individual Divide What causes people to support one party instead of the other?
B. Race and Ethnicity • If you can pick one characteristic about a person and then predict their own party identification, ask about race and ethnicity: better predictor than age, sex, income, education, geography, etc.
‘04 Racial Dividea. About 90% of African-Americans Vote Democratic
b. Race Trumps Rural Issues: Rural Counties by Race/Ethnicity
3. Asian-Americans: Pro-Democrat a. Similarities to Latino vote: • Majority too young or noncitizens • Country of origin effects • Importance of immigration and language issues • Decreasing Democratic advantage? Mixed results due to small sample sizes b. Election 2004: Asian-Americans vote for Kerry by 3:1 margin
4. Native Americans: Pro-Democrat • No exit polling data – findings based on geographic comparisons
C. Income: Better predictor since 1980s2004 Exit Polls: Overall • Income %R%D • <$15K 36% 63% • $15-30K 41% 58% • $30-50K 48% 51% • $50-75K 55% 44% • $75-100K 53% 46% • $100-150K 56% 43% • $150-200K 57% 43% • >$200K 62% 37%
D. Religiosity • Fiorina: Salience of religion better predictor than denomination
2. Fiorina’s Explanation • Women more dovish on security • Women more pro-government on social programs • Since 1970s Democrats have been both more dovish and more pro-government on social programs gender gap
F. Population Density 1. Urban areas trend Democratic, Rural areas trend Republican
County Map of Population Density: Republicans Win Most Rural Counties
b. Shift in Rural Partisanship: Rural support for Republicans (Blue) and Democrats (Red)
2. The suburban majority: Voting splits on North/South lines Suburbs split 50-50 in 2000, 53-47 in 2004
G. Age 1. Democrats do well among the very young and the old
G. Age • Democrats do well among the very young and the old • But young are most likely to be independents
H. Education? Little effect… • Education appears to increase Republican ID, but.. • Education increases income, which may be responsible • Controlling for income results in no effect or even pro-Democratic shift • Very high levels of education (PhD) dramatically increase Democratic ID • Education does tend to bring party ID in line with professed ideology
I. Conclusions About Party ID White Race Anglo Ethnicity Republican Parents Male Highly Religious Rural Age 25-40 + + Republican Self-Identification + + + + +
III. Regional Divides? A. Voting History