Download
1 / 22
230 likes | 346 Views
On the Road to a New Metropolitan Transportation Plan. Spokane Regional Health District Board of Health April 25 , 2013. Metropolitan Planning Organizations (MPOs).

E N D
On the Road to a New Metropolitan Transportation Plan Spokane Regional Health District Board of Health April 25, 2013
Metropolitan Planning Organizations (MPOs) • Purpose is to ensure that the expenditure of federal transportation funds is based on a continuing, cooperative & comprehensive (3-C) process • Lead agency for transportation planning and decision-making in the metropolitan planning area • SRTC is also a federally designated Transportation Management Area (urban areas over 200,000) which brings more discretion in selecting projects for certain federal funds 6 7 8 1 4 9 5 2 3 10 12 11 • State designated Regional Transportation Planning Organization (RTPO)
Metropolitan Transportation Plan – Purpose • Satisfy federal and state planning requirements • 20+ year blueprint that establishes regional priorities and guides multi-modal transportation investments • All federally funded transportation projects must be consistent with the MTP and must be included in SRTC’s 4-Year Transportation Improvement Program • Regionally significant projects
Document Organization Executive Summary Chapter 1 – Who We Are Introduction/Purpose Prelim. Draft Chapter 2 – Where We’re At Current Conditions Prelim. Draft Chapter 3 – Where We’re Going Future Conditions Prelim. Draft Chapter 4 – How We’ll Get There Strategies July Appendices Summary Folio – Maps, Exhibits √ √ √
Quality of Life • Livability • Partnership for Sustainable Communities • Provide more transportation choices • Promote equitable, affordable housing • Increase mobility • Lower combined cost of housing and transportation • Value communities and neighborhoods • Invest in healthy, safe and walkable neighborhoods
Quality of Life (cont’) • Centers for Disease Control (CDC) • Transportation Strategies • Enhance infrastructure supporting bicycling and walking • Improve access to public transportation • Enhance personal and traffic safety in areas where persons are or could be physically active • SRHD and City of Spokane – 2012 “mixed land uses, residential and employment density, and street connectivity are all positively correlated with fewer vehicle miles traveled, greater use of transit, and increased physical activity.”
Housing Affordability 2011 Median Income Spokane County = $49,257 Washington State = $58,890
Housing + Transportation Costs - Affordability $8,964 (sedan average @ 15,000 miles per year) AAA Your Driving Costs, 2012 Edition
Spokane County Households (34% in 1990) Source: U.S. Census Bureau, 2010 Census
Diverse Transportation Needs - Today • Economic Vitality/Jobs • Freight corridors • Urban transportation corridors • Seniors/65 and over (12.9% of population) • People with disabilities (13.5% of population) • Low income (14.4% of population)
Pavement Preservation - Washington State Very Good Pavement 2008 – 43.2% 2010 – 31.5% The Gray Notebook 44, February 22, 2012
Spokane County Bridges - 2011 National Bridge Inventory Data • 377 total entries (bridge “structures” or spans) • 275 of the 377 spans were evaluated for condition • 21 (7.6%) are structurally deficient (SD) • 65 (23.6%) are functionally obsolete (FO) • 140 bridges were built before 1962 • 26 “reconstructed” within the last 50 years (majority in the 1990s and 2000s) • Total estimated cost for bridge improvements • $226,252,000 for SD (2 do not have entries for costs) • $567,575,000 for FO (15 do not have entries for costs) • $1,910,180,000 for all structures • Washington State has 7,627 bridges-5% SD and 21% FO
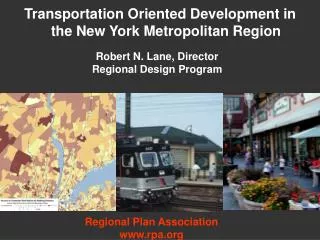
What About Transit? New Transit Has Spurred Development • Urban corridors are: • Neighborhoods/districts that can accommodate new mixed-use development • Roads that can accommodate multi-modal travel: cars, transit, bikes, and pedestrians Source: LEHD 2008; Center for Transit-Oriented Development 2010
Employment Centers Transit Focused Jobs = 113,612 Freight Focused Jobs = 80,932
Current MTP $7.8 billion Financially Constrained Revenue Estimate $ (finite resource) Street Capital Street Maint. TDM ITS Transit Bridges Bicycle Pedestrian
Next Steps • Financial Plan • Scenario Analysis • Strategies • Chapter 4 preliminary draft ~July • Executive Summary ~August • Agency review period ~mid-Aug. through mid-Sept. • Public comment period ~mid-Sept. to mid-Oct. • SRTC Board approval ~November/December
Closing Thoughts • Today’s transportation questions are more complex than they were 20 years ago • The next 25 years will be very different from the previous 25 years • Funding is limited • prioritize transportation projects/programs • Our transportation systems need to be more integrated to serve the diverse needs of our region • Regions that can build and maintain consensus are more effective than those that cannot
QUESTIONS? Ryan Stewart Senior Transportation Planner Phone: (509) 343-6370 Web: http://www.srtc.org On the Road to a New Metropolitan Transportation Plan