Download
1 / 40
400 likes | 461 Views
Measurement. 9/6/2012. Readings. Chapter 3 Proposing Explanations, Framing Hypotheses, and Making Comparisons (Pollock) (pp.48-58) Chapter 1 Introduction to SPSS (Pollock Workbook) . Opportunities to discuss course content. Office Hours For the Week. When Friday 11-1 Monday 11-1

E N D
Measurement 9/6/2012
Readings • Chapter 3 Proposing Explanations, Framing Hypotheses, and Making Comparisons (Pollock) (pp.48-58) • Chapter 1 Introduction to SPSS (Pollock Workbook)
Office Hours For the Week • When • Friday 11-1 • Monday 11-1 • Tuesday 8-12 • And by appointment
Course Learning Objectives • Students will learn the research methods commonly used in behavioral sciences and will be able to interpret and explain empirical data. • Students will learn the basics of research design and be able to critically analyze the advantages and disadvantages of different types of design.
A Test of Scientific Knowledge A Causal Hypothesis
What is a causal hypothesis? • The Boldest Hypothesis out there • A relationship that will occur 100% at all times, no exceptions • Difficult to Prove
To Prove a Causal Hypothesis • A Change in the Independent Variable will always cause a change in the dependent variable. • A change in X always precedes a change in Y • X is necessary and sufficient to cause a change in Y
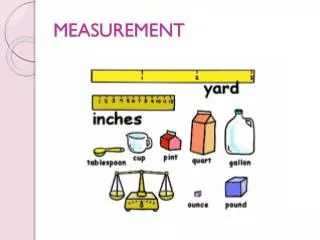
What is Measurement • How we quantify our concepts • The most basic measures talks about how much (votes, money, etc).
Good Measures • Start with Good Operationalization • Are precise and accurate • Can actually be done • This is difficult
Bad Measures • Are unreliable • Are inaccurate • This leads to bad conclusions
Measurement Validity • A measure is valid if it measures what it is supposed to measure • The measure and the concept correspond
Operational Validity • The measure does what it says • This can be difficult to establish
Face Validity • The simplest way to seek validity • The Measure looks good on its face • We ask People, use the literature • Problems?
Content Validity • Using several measures of a concept to get at the whole concept • Good for multi-dimensional concepts (e.g. political participation)
Trust in Government • Trust the Federal Government • Is the Government Run for the Benefit of All • Do People in Government Waste Tax Money • Are Government Officials Crooked
Freedom House Index • 27 Questions • Electoral process • Political pluralism & participation • Functioning of government • Freedom of expression & belief • Associational & organizational rights • Rule of law • Personal autonomy and individual rights
Predictive Validity • Using a measure to predict a future outcome • This is very difficult in the social sciences
The NFL Combines • 40-yard dash • Bench press • Vertical jump • Broad jump • 3 cone drill • Shuttle run
The LSAT’s • The LSAT is designed to measure skills that are considered essential for success in law school • The LSAT is a strong predictor of first-year law school grades • What doesn’t it measure?
Measurement Reliability • A measurement will provide the same results upon repeated tests • The more consistent the results… the more reliable the measure
Random Error • Outside of the control of the researcher • Outlier case • People’s feelings • weather • Large sample sizes reduce this
Non-Random Error • Systemic Researcher Error • Poor design • Lazy administration • Intentional error • Small samples • carelessness • This will distort the measure of a concept
Ensuring Reliability • Good Definitions and unambiguous questions • Clear Directions • Making results and information available to other researchers
Methods for ensuring Reliability • Alternative forms technique • Test-Retest
A measure can be reliable without being valid, but a measure cannot be valid without being reliable!
A way of getting content validity Indexes and Scales
Why create a scale/index? • To form a composite measure of a complex phenomenon by using two or more items • Get at all facets • Simplify our data
Examples • GPA
Likert Scale • A common way of creating a scale • Advantages • Disadvantages
Guttman Scaling • Employs a series of items to produce a score for respondents • Ordering questions that become harder to agree with • Advantages and disadvantages