Download
1 / 17
170 likes | 269 Views
Health Department Name. Insert Health Department Logo. Health Department Facts. Location Size Population served. Team Members. List team members, their role within the health department, and their role on the MACQIC team. PLAN Understand the system and select the teams.

E N D
Health Department Name Insert Health Department Logo
Health Department Facts • Location • Size • Population served
Team Members • List team members, their role within the health department, and their role on the MACQIC team.
PLANUnderstand the system and select the teams • What is the possible opportunity, and how did you know it was an opportunity. Give benchmark data.
PLANUnderstand the system and select the team • Insert the CQI tools that you used to understand your possible opportunities (brainstorming, affinity diagram, Pareto diagram, logic model, matrix diagram etc.)
PLANDefine the opportunity • Insert your aim statement, or what you are trying to accomplish.
PLANDefine the opportunity • Who are the clients/stakeholders and what are their needs.
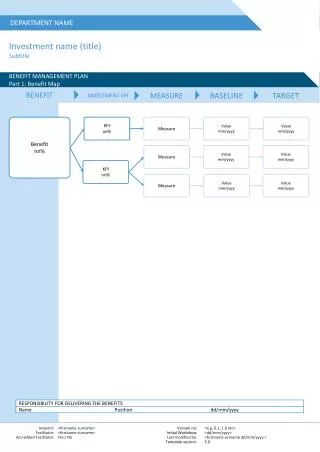
PLANStudy the current situation • What is the current approach or process flow. Insert your process flow chart or other CQI tools that describes your approach.
PLANWhat data or information is needed • What data or information is needed, how will it be collected, how will it be displayed, what is the prediction.
PLANWhat data or information is needed (continued) • Insert the CQI tools you used to understand the current data (bar charts, frequencies, survey, etc.)
PLANAnalyze the causes • What are the root causes of the problem. • Insert the CQI tools that you have used to analyze the data (fishbone diagram, Pareto diagram, etc.)
DOSelect and develop a theory for improvement • Describe the initial Rapid Cycle Improvement (RCI) you implemented.
DOImplement the theory for improvement • Describe the data that was collected, and what CQI tools you used to determine the effectiveness of the improvement.
STUDYStudy the results • Describe the results from the data collected, and include the CQI tools you used (Pareto diagram, control chart, bar chart, etc.)
STUDYStudy the results (continued) • Was the test successful or will you develop a new theory.
ACTStandardize the improvement • Describe how improvements will be institutionalized.
ACTReflect and establish future plans • What happens next?