Download
1 / 10
100 likes | 257 Views
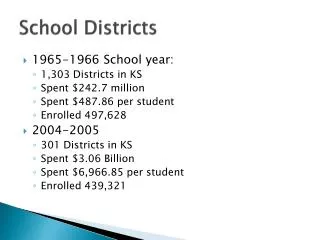
School Districts and Charter School Financial Data. Dr. Chuck Essigs. School District State Formula. Charter School Funding Formula 2011-2012 School Year. Comparison – School District to Charter Formula. Some Issues. District could qualify for teacher experience index 1-3%

E N D
School Districts and Charter School Financial Data Dr. Chuck Essigs
Some Issues • District could qualify for teacher experience index 1-3% • Some districts have Career Ladder (Elimination process started) • Districts and charters qualify for small school adjustment (less than 600), but multiple charter applications qualify more charters
District Options • Overrides up to 15% (voter approval) • Bond elections (reduced limits of 10% of AV for unified and 5% of AV for elementary and high school districts) voter approval • Impact Aid Revenue Bonds
Charter Considerations • Set capacity by total and grade level • No spending limit allows unlimited carry over
Total Expenditures 2009-2010 School Year Source: Annual Report of the Superintendent of Public Instruction
Current Expenditures per Pupil Source: Annual Report of the Superintendent of Public Instruction