Download
1 / 33
610 likes | 1.49k Views
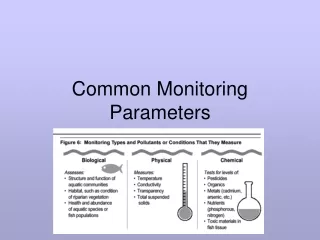
Common Soil Parameters. What are the common parameters of soil that we could test?. The 3 soil attributes. Physical attributes Texture, structure, etc Biological attributes Organic content Chemical attributes pH, conductivity, cations, anions etc. Physical Properties. Colour.

E N D
Common Soil Parameters What are the common parameters of soil that we could test?
The 3 soil attributes • Physical attributes • Texture, structure, etc • Biological attributes • Organic content • Chemical attributes • pH, conductivity, cations, anions etc
Colour • described by using a Munsell Colour Chart • describe colour in terms of Hue, Value, and Chroma. • A typical designation is 10YR 5/2. This is the symbol of a greyish brown colour with 10YR hue, 5 value, and 2 chroma • The symbol components are always arranged in this sequence.
Soil Colour Determination • Hue - colour of pigment that must be mixed with black and white (or the proper shade of grey) to produce the colour to be matched • Soils range in hue from red (R) through yellow-red (YR) to yellow (Y) with some spots of green-yellow (GY) or even green (G). • 0-10 prefixes divide the space between the absolute hues • eg 7.5YR • value - the square root of the percentage of light reflected • soils range from 2 to 8
Soil Colour Determination Chroma • the amount of pigment that must be mixed with the proper value of grey to produce the particular colour • pure grey colours have 0 chroma • increasing brightness is indicated by chroma’s up to about 8 in soils
Soil Texture • Soil Texture is the most commonly used descriptor of a soil. • Texture is a property of the fine earth (<2mm) fraction that depends on the particle‑size distribution. • Particle size in this fraction varies from 2mm diameter down to less than 0.1mm • The distribution of particles over this size range influences many important soil properties such as ease of cultivation and water‑holding characteristics.
Soil Texture • Soil is allocated to a textural class, depending on its content of sand‑, silt‑ and clay sized particles. • In the field, determined subjectively from the feel of a moist soil molded between the fingers and thumb • This is because the particle‑size distribution influences the mechanical properties of the material.
Class Exercise 1 Finger assessment of soil texture for mineral soils
Soil Structure • Described as weak, moderate, or strong depending on how distinct the peds? are. • Fine, medium, or coarse depending on the size of the peds. • Shape of the peds - platy, granular, blocky, columnar, or prismatic,
Settling rate lab. method for the silt‑size particles plus some of the coarse clay, • rate of settling is proportional to the square of the diameter of the particles • v = 6000d2 • v is the settling velocity in cm/minute • d the particle diameter in mm • two sizes needed for determining soil texture; limits between: • sand and silt (0.05 mm) and • silt and clay (0.002 mm)
Example 8.1 • Calculate how far a 0.05 mm diameter particle would travel in one minute. • v = 6000 x 0.052 • = 15 cm/min • in 1 minute, particles of this size would have travelled 15 cm
Exercise 8.2 • Would larger particles than 0.05 mm travel more or less than 15 cm in this time? • More • What does this mean about the sand fraction? • It would sink faster • Calculate how long a 0.002 mm diameter particle would take to travel 1 cm. • v = 0.024 cm/min • 1 cm in 41.7 minutes
Applying this in the lab • a uniform suspension of soil in water is allowed to settle for one minute • a sample is then withdrawn from a depth of 15 cm • will contain no particles larger than 0.05 mm diameter • larger particles will have settled beyond that depth even if they started at the surface • the sample will contain silt and clay only • any particles smaller that had sunk from this level will be replaced from above • repeat at a depth appropriate for 0.002 cm • eg 3 cm after 2 hours
Exercise 8.3 answers • 40 x 2.04 g = 81.6 g • 40 x 0.40 g = 16 g • 81.6-16 = 65.6 g • Silt 66.8%, clay 16.3%, sand 16.9% • silt loam
Soil Water • The amount of water present in the soil at any one time is most commonly expressed as a percentage of the oven‑dry weight of the soil • Percentage is commonly determined for the field capacity of the soil and for air‑dry soil. • These two percentages are used as limits to classify the water present in a soil after a rain as gravitational, capillary, and hygroscopic
Soil Conductivity • Determined quantitatively by a conductivity meter. • Standard water:soil mix • An important parameter when assessing salinity. • Used to estimate the concentration of soluble salts in the soil (Na+, Mg2+ and Ca2+ , Cl-, SO42- and HCO3-). • Soluble fertiliser may also contribute K+, NH4+ and NO3-. • High EC is undesirable for most plants.
Stone Content • affect soil fertility by taking up space • reduce ability of a given volume of soil to hold water and nutrients • a hindrance to cultivation • measured by eye in the field • by separation and weighing in the lab
Soil pH • Tested with a calibrated pH meter. • Soil solutions are well buffered – do you remember what this term means? • By using a standard, valid comparisons between soils can be made (absolute values are difficult to interpret)
Soil pH • Measurements can be made in the surface layer of a moist soil provided sufficient water is present to make liquid contact between the electrodes. • Under some circumstances where buffering capacity is not adequate, soils maybe suspended in 0.1M KCl for pH determination • There are many ways by which the pH of a soil can be measured – refer to handbook
Calcium Carbonate Content - Field Method • Field estimate of CaCO3 content is based on the reaction of soil with dilute acid giving both visible and audible effects. • Method is only approximate and not sensitive to differences in CaCO3 contents above 10%.
Organic content • determined by oxidative digestion (dichromate) • measured by: • back titration of excess dichromate • colorimetry of green product
Nitrogen • wet ashing with conc. sulfuric • formation of ammonium ions • converted to ammonia (NaOH) • steam distillation • collection in boric acid • titration with std HCl • known as the Kjeldahl method – standard for N • doesn’t pick up NO2/NO3 • need conversion by initial reduction
Phosphorus • availability vs total a major issue for P • various extraction solution to assess availability, eg Olsen 0.5 NaHCO3 • analysis by: • ICP • XRF • colorimetry
Micronutrients • can exist in soils in: • water‑soluble • exchangeable • adsorbed • complexed • secondary clay minerals • insoluble oxides • primary minerals • extraction with chelating DTPA and ICP analysis
Sodium absorption ratio (SAR) • predictor of salinity • measure Ca, Mg & Na in mmole/L • use eqn or nomogram
Exercise 8.4 • A soil is tested for leachable Na, Ca and Mg, and the results are (in mmole/L: 15, 3 and 2 respectively. What is the SAR?
Cation exchange capacity (CEC) • relies in the removal of ions with a concentrated solution of an ionic substance intended to drive off the adsorbed ions • techniques used to analyse the released ions include: • titration with EDTA – Ca & Mg • flame AAS – Na, K • ICP emission - all • Kjeldahl N analysis – all adsorbed ions are replaced by NH4, which are then released by excess K; the ammonium is then analysed • some methods use approximations and correction factors to achieve quick result
pH buffering capacity • adding known amounts of acid (as HCl) or alkali (as NaOH or lime) to soils • allowing a equilibrium period before measurement of pH • graph of amount added (per kg of soil) vs pH plotted • buffer capacity is the slope of the graph • quoted as an amount of acid or alkali (typically millimoles H+ or g CaCO3) per kg of soil per pH unit.
Pesticides • residues left in soils from pesticides or their by-products • analysed by GC-MS for sensitivity and ease of identification