Download
1 / 17
170 likes | 328 Views
Application of Greenhouse Gas Satellite Observations at Environment Canada. Ray Nassar Climate Research Division - CCMR ray.nassar@ec.gc.ca NOAA-NASA-EUMETSAT Satellite Workshop Miami, FL - 2011 March 30. Outline. Overview of surface and satellite CO 2 observations

E N D
Application of Greenhouse Gas Satellite Observations at Environment Canada Ray Nassar Climate Research Division - CCMR ray.nassar@ec.gc.ca NOAA-NASA-EUMETSAT Satellite Workshop Miami, FL - 2011 March 30
Outline • Overview of surface and satellite CO2 observations • TES and flask CO2 flux inversion work • Development of Environment Canada Carbon Assimilation System (EC-CAS) • Future plans/directions
Global Greenhouse Gas Measurement Network World Data Centre for Greenhouse Gases NOAA (US), Europe, Environment Canada, CSIRO (Australia), JMA (Japan) ... WMO - World Data Centre for Greenhouse Gases (WDCGG)
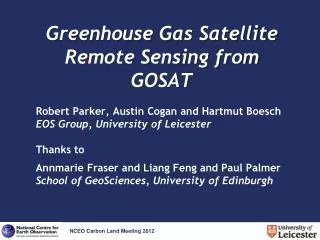
Satellite Observations of CO2 March-April-May multi-year average TIR emission HIRS AIRS TES IASI Kulawik et al. (2010) Crevoisier et al. (2009) Chédin et al. (2003) Chahine et al. (2008) NIR reflectance GOSAT TANSO-FTS SCIAMACHY *GOSAT has both TIR and NIR observations Buchwitz et al. (2007) Yokota et al. (2009) Limb (TIR): ACE-FTS, MIPAS
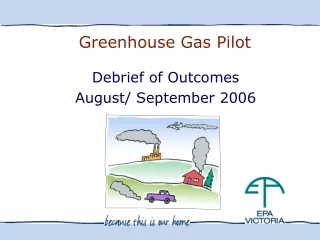
Tropospheric Emission Spectrometer (TES) CO2 • TES - Fourier Transform Spectrometer on Aura in the A-Train • Observes TIR emission 650-3050 cm-1 (or 3.3-15.4 mm) at ~1:40/13:40 local time • Small footprint (5.3 x 8.3 km2)helps to avoid clouds • Coarse CO2 profile sensitivity is given by the averaging kernel matrix • Peak sensitivity at 511 hPa (~5 km) • between ~40°S-40°N Rows of Averaging Kernel S. S. Kulawik, D.B.A. Jones, R. Nassar, F.W. Irion, J.R. Worden, K.W. Bowman, T. Machida, H. Matsueda, Y. Sawa, S.C. Biraud, M. Fisher, A.R. Jacobson (2010), Characterization of Tropospheric Emission Spectrometer (TES) CO2 for carbon cycle science, ACP, 10, 5601-5623 Susan Kulawik, JPL
CO2 Flux Inversion Approach • GEOS-Chem model using GEOS-5 assimilated meteorology from NASA Global Modeling and Assimilation Office (GMAO) - 2º latitude x 2.5º longitude • CO2 fluxes: fossil fuels (CDIAC monthly from national inventories, international shipping/aviation), biosphere (balanced diurnal CASA + annual climatology, biomass and biofuel burning, ocean flux, chemical production from CO, CH4 and other carbon • Determine CO2 sensitivities for 40 regions for 2006 • Sampled model at TES observation locations (ocean only, 40°S-40°N) and times to calculate 5°x5° monthly averages at 511 hPa • Sampled model at 59 surface flask locations (NOAA and EC) to obtain monthly averages • Conduct time-independent, annual Bayesian inversions with monthly TES and/or flask data • A priori flux uncertainties: Baker et al. (2006) for land regions and Gruber et al. (2009) for ocean regions • Accept fossil fuel inventories and solve for “natural” fluxes (ocean, terrestrial exchange + biomass + biofuel) 3-D CO2 Chemical Production ~ 1.1 Pg C/yr Nassar et al. (2010), Geoscientific Model Development, 3, 689-716 (University of Toronto)
CO2 Fluxes by Combining TES and Flask data 2006 R. Nassar, D.B.A. Jones, S.S. Kulawik, J.R. Worden, K.W. Bowman, R.J. Andres, P. Suntharalingam, J.M. Chen, C.A.M. Brenninkmeijer, T.J. Schuck, T.J. Conway, D.E. Worthy (2011),Inverse modeling of CO2 sources and sinks using satellite observations of CO2 from TES and surface flask measurements, ACPD, 11, 4263-4311
TES and Flask CO2 are Complementary TES and flask data together give the best agreement with independent ship (NOAA) and aircraft (CARIBIC) flask data as a result of the complementary vertical and horizontal information ship station aircraft Ships Aircraft Nassar et al. (2011), ACPD, 11, 4263-4311
Comparison of CO2 Flux Inversions for 2006 Persistent discrepancies between the inversion systems highlight the need for more sophisticated approaches including better accounting of error terms Nassar et al. (2011), ACPD, 11, 4263-4311
Integrated Global Carbon Assimilation System Source: GEO Carbon Strategy
Developing Canadian GHG Assimilation Capabilities • Starting well behind the US, Europe, Japan with less available human resources and money • Aim to develop a competitive system at Environment Canada using most advanced techniques • Will take advantage of Environment Canada expertise with: - Numerical Weather Prediction (NWP) and stratospheric data assimilation using the Global Environmental Multiscale model (GEM) - Carbon-climate modelling expertise at Canada Centre for Climate Modeling and Analysis (CCCma) - Application of atmospheric satellite observations and data from ground-based networks
Global Environmental Multiscale (GEM) Model • Canadian operational weather forecast system: Côté et al. (1998), MWR, 126, 1373-1395 • Ingests data from GOES-E/W, METEOSAT-E/W, MTSAT, ATOVS, AIRS, IASI, COSMIC, … • 4DVar and Ensemble Kalman Filter (EnKF) versions: Buehner et al. (2010), MWR, 138, 1550-1566 and 1567-1586 GEM extended for tracer transport • Model for Air quality and Chemistry (GEM-MACH) • GEM-AQ: Kaminski et al. (2008), ACP, 8, 3255-3281 GEM applied to GHGs • CO2 and CH4 work: Chan et al. in preparation • Work on coupling to biospheric models (Biome-BGC, BEPS, CTEM) now in progress
Environment Canada Carbon Assimilation System (EC-CAS) plan • Development led by Saroja Polavarapu (EC), Ray Nassar (EC), Dylan Jones (UofT) • Adapt GEM operational Ensemble Kalman Filter (EnKF) to CO2 flux estimation • Augmented state: both CO2 concentrations and CO2 fluxes • Sequential estimation using past and future observations – Kalman Smoother • Ensemble approach: perturb initial concentrations, fluxes, meteorology, model error, etc. giving multiple ensemble members to estimate the sizes of error components • Forward model development • Assess and reduce transport errors e.g. lack of mass conservation implications • Apply best available inventories for fossil fuels (national + shipping/aviation), biomass and biofuel burning, and ocean flux • Couple to a biosphere carbon model • CO2 chemical production from oxidation of CO, CH4 and other carbon • Observations • CO2, CH4, CO in situ data and satellite observations (NIR/TIR sounders) • Implement quality control and bias correction schemes, and rigorously account for representativeness errors for each instrument and species
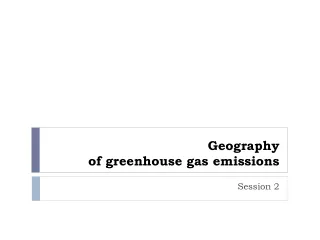
Satellite Observations • NIR reflectance XCO2: GOSAT, OCO-2 (~2013) • TIR emission CO2: GOSAT, IASI, AIRS, TES • Other carbon species (CO, CH4) GOSAT XCO2 2009-09 Will this be enough? v1.2 averaged at 2°x2.5° 350 400
Observing the Northern CO2 Diurnal Cycle • Strong diurnal cycle of near-surface CO2 over Boreal Forests, but not north of tree line • XCO2 diurnal amplitude < 1 ppm over forests, not observable in sun-sync LEO Park Falls (46°N) surface Boreal Forests XCO2 (column) www.borealforest.org Fraserdale (ON) 50°N Alert (Nunavut) 82°N surface in situ MATCH model Higuchi et al. (2003), Tellus 55B, 115-125 Olsen & Randerson (2004), JGR 109, D02301
PCW-PHEMOS • Polar Communications and Weather (PCW) mission (2017): 2 operational met satellites in Highly Elliptical Orbit (HEO) for quasi-geostationary observations along with a communications package • Polar Highly Elliptical Molniya Orbit Science (PHEMOS) suite of imaging spectrometers • Weather Climate and Air quality (WCA) option is now entering phase-A study (see talk by J.C. McConnell on Thursday) • Quasi-continuous coverage of GHGs over the high latitudes (~40-90°N) using TIR+NIR would help constrain GHG sources/sinks at fine temporal scales Trischenko & Garand (2011)
Summary • Combining surface-based and satellite observations of CO2 for constraining CO2 fluxes has now been demonstrated, and shown to have complementary vertical and horizontal information • More sophisticated GHG assimilation systems are possible and are being developed by many organizations including Environment Canada • Utilization of NIR reflectance (columns with surface sensitivity), TIR emission (mid/upper troposphere) and ground-based data appears to be the way forward • LEO constellations or GEO/HEO are needed to constrain fluxes at the spatial and temporal scales desirable to address important science questions and policy needs