Download
1 / 56
560 likes | 780 Views
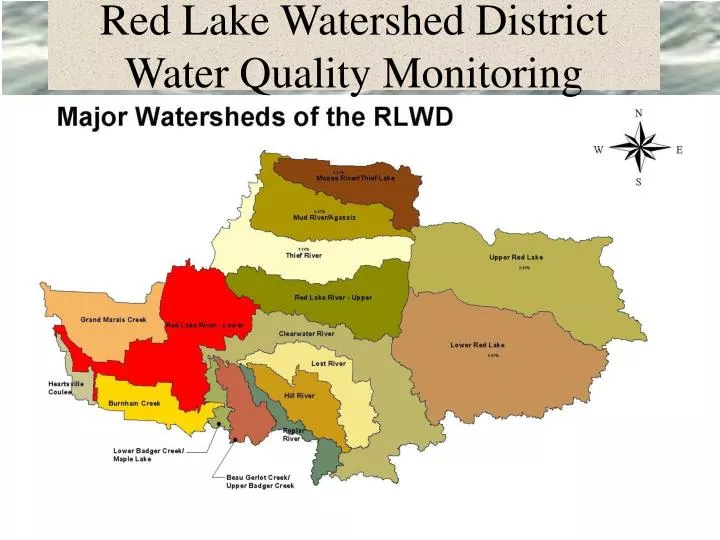
Red Lake Watershed District Water Quality Monitoring. Water Quality Projects. Water Quality Monitoring Over 30 sites At least 4 samples per year Lake and Stream Monitoring Special Studies Clearwater Lake Water Quality Model, Habitat/bioassessment, Tile Drainage Study

E N D
Water Quality Projects • Water Quality Monitoring • Over 30 sites • At least 4 samples per year • Lake and Stream Monitoring • Special Studies • Clearwater Lake Water Quality Model, Habitat/bioassessment, Tile Drainage Study • Water Quality Improvement Projects • Erosion Control • BMP Implementation
All Sites Within the RLWD • Historical and Current
Lake Monitoring • Clearwater Lake • Mesotrophic • Maple Lake • Eutrophic • Cameron Lake • Hypereutrophic
Field Measurements • Dissolved Oxygen (mg/L) • Water Temperature • pH • Conductivity • Turbidity (NTUs) • Transparency (cm)
Laboratory Analysis • Total Suspended Solids • Total Dissolved Solids • Total Phosphorus • Orthophosphorus • Nitrates and Nitrites • Ammonia Nitrogen • Total Kjeldahl Nitrogen • Fecal Coliform • Chemical Oxygen Demand
Review of 2005 Pre-Assessment • Use MPCA assessment methods on RLWD data to see if the available data supports the assessment • Will focus on the supported uses of aquatic life and recreation (will not cover Hg Impairments)
State Standards • Turbidity – 25 NTU • Dissolved Oxygen – 5 mg/L (7 mg/L for Class 2A) • Fecal Coliform - 200 col/100ml, no months with a geometric mean > 200 • pH – 6.5 – 8.5 • Conductivity – 1,000 mg/L • Total Dissolved Solids – 500 mg/L
Ecoregion Values 75th Percentile of values within an ecoregion (minimally impacted)
(2002, 2004) 2004 MPCA Assessed Reaches
Current Impaired Waters in the RLWD • Red Lake River; Burnham Creek To Unnamed Creek (East Grand Forks) – Turbidity • Red Lake River; Unnamed Creek to Red River – Turbidity • Poplar River; Spring Lake to Hwy 59 – Low Oxygen • Clearwater River; Ruffy Brook to Lost River – Fecal Coliform, Low Oxygen • Lost River; Silver Creek to Hill River – Fecal Coliform • Clearwater River; Trout stream portion – Fecal Coliform • Walker Brook; Walker Brook Lake to Clearwater River
Fully Supporting Streams • Mud River • T150 R33W S16 south line to Lower Red Lake • NEB2 • Our Data Supports This Assessment
Fully Supporting Streams • Red Lake River – Headwaters to Thief River • True
Fully Supporting Streams • Cyr Creek – Headwaters to Red Lake River • Could not find supporting data • No RLWD sites
Fully Supporting Streams? • Burnham Creek – Unnamed Creek to Unnamed Creek • Great Description (Where is the reach?) • No other water quality monitoring sites on Burnham Creek are shown on the EDA website. • This assessment may or may not be true, but it seems that it is not based upon any data, unless they are using some data that is not yet entered into STORET.
Fully Supporting Streams? • Kripple Creek – Unnamed Ditch to Unnamed Creek • Once again, a very helpful description • No data available from RLWD, River Watch, or EDA
Fully Supporting Streams • Mud River – Headwaters to Agassiz Pool • RLWD data supports this assessment • Site #757
Fully Supporting Streams • Lower Badger –CD 14 to Clearwater River • Sampled during Clearwater River Habitat/Bioassessment • Good habitat
Fully Supporting Streams • Lost River – Pine Lake to Anderson Lake • RLWD Data supports this assessment
Fully Supporting Streams • Lost River – Anderson Lake to Hill River • 782 – Supports assessment but doesn’t meet TDS or pH standards (pH basic) • PL30 – No impairment other than 25% excedance rate for TDS
Fully Supporting Streams • Clearwater River – Clearwater Lake to Ruffy Brook • Very good water quality @ Clearwater Lake Outlet
Fully Supporting Streams • CD 14 – Headwaters to Lower Badger Creek • RLWD data from the beginning of this reach supports this assessment
Fully Supporting Streams • Poplar River (Diversion) – Pond to Badger Creek • RLWD data shows that it is Not Supporting for DO
Fully Supporting Streams • Judicial Ditch 64 – Unnamed Ditch to Lower Badger Creek • Data?
Fully Supporting Streams • Unnamed Creek (JD73/Poplar River Diversion/Maple Lake Inlet) – Tamarack Lake to Maple Lake • True
Red Lake River – Burnham Creek to Unnamed Creek • Currently Listed • Turbidity • We Currently Have No Sites Within This Reach
Red Lake River – Crookston Dam to Burnham Creek • Excess Sediment – List? • 790 – Crookston
Red Lake River; Unnamed Creek to Red River • Turbidity • Our data supports this listing • Murray Bridge
Red Lake River – Thief River to Thief River Falls Dam • Fecal Coliform – Partially Supporting • Our data doesn’t show an impairment • No data in STORET that supports this impairment according to the MPCA Environmental Data Access (EDA) website
Burnham Creek – Unnamed Creek to Red Lake River • Sediment, Nitrogen • Site #799 • NO3+NO2 • 75th = .438 mg/L vs. .20 (RRV ecoregion) • RLWD Data Supports Sediment Listing
County Ditch 65 – Unnamed Lk (60-0317) To Burnham Creek • Partially Supporting – Dissolved Oxygen • What data is this based upon? • No RLWD or River Watch data • No data in STORET according to MPCA EDA site • Glacial Ridge Study?
County Ditch 140 – Unnamed Ditch to Gentilly Creek • Exceeds Phosphorus • No data from RLWD or Riverwatch • No data on the EDA website • Data from USGS Glacial Ridge Water Quality Study? – ditch is near/within the study area
Thief River – Agassiz Pool to Red Lake River 40 760, RRBMN Site
Thief River – Agassiz Pool to Red Lake River • Partially Supporting –Dissolved Oxygen • Not Supporting – Turbidity • Data from RLWD and RRB Monitoring Network
Thief River – Agassiz Pool to Red Lake River • RLWD Data • Fecal Coliform Exceedances found after last STORET submission
Thief River – Thief Lake to Agassiz Pool • Fully Supporting • RLWD Data Shows Impairments • 1 low DO reading since 2002
Moose River – Headwaters to Thief Lake • Partially Supporting – Dissolved Oxygen • Exceeds Sediment • Not supported by RLWD data, River Watch?
Clearwater River – Lower Badger Creek to Red Lake River • Not Supporting – Turbidity • Exceeds sediment • Site 785 – also a River Watch and RRBMN site • RLWD data supports Turbidity Impairment + High TSS levels
Poplar River – Highway 59 to Lost River • Phosphorus • Ecoregion TP 75th: .322 mg/L (RRV) • RLWD 75th: .173 mg/L
Walker Brook – Walker Brook Lake to Clearwater River • Not Supporting – Dissolved Oxygen • TMDLs on the Clearwater River Study • Impairment is due to natural factors • Groundwater, organic soils (fens), low flow • Being reclassified
Clearwater River – Ruffy Brook to Lost River • Exceeds Phosphorous • pH = 12.82% Exceedance • TP 75th = .131 mg/L (Ecoreg 75th = .322) • Site #780
Ruffy Brook – Headwaters to Clearwater River • Partially Supporting – Fecal Coliform • 27.27% exceedance in RLWD data • July and September have >200 col/100ml G.M., but <5 samples
Clearwater River – T148 R35W S31 west line to Clearwater Lake (Trout Stream Reach) • Partially Supporting – Fecal Coliform • TMDLs on the Clearwater River Study found that there is no longer an impairment
Clearwater River – Headwaters to T148 R36W S36 East Line • Not Supporting – Dissolved Oxygen • Exceeds Phosphorus • DO: Partially Supporting @128, Non @ 0-6 • TP 75th = .05 @ 128 • TP 75th = .091 @ 0-6 • NLF Ecoregion • 75th = .052
Poplar River; Spring Lk to Hwy 59 • Partially Supporting - Dissolved Oxygen - Yes • Exceeds Phosphorus - Yes • TP 75th % = .2 mg/L vs .17 mg/L for NCH 109
Silver Creek – Headwaters to Anderson Lake • Partially Supporting – Fecal Coliform • RLWD data supports this • Stormwater study found very high levels on Clear Brook (tributary that flows through the town of Clearbrook)
Lost River –T148 R38W S17 South Line to Pine Lake • Partially Supporting – Dissolved Oxygen • Partially Supporting – Fecal Coliform • Dissolved Oxygen – Yes • Impaired by Fecal Coliform? • Step 1 = 12.5% • Step 2 = No