Download
1 / 54
540 likes | 828 Views
Chapter 1 - Exploring Data AP Statistics Amanda Carter Borrowed from Brian Hamilton & Jason Molesky. Chapter 1 Section 1 Displaying Distributions with Graphs. HW: 1.1(a, b), 1.2, 1.3, 1.4, 1. 5, 1.6 1.8, 1.9, 1.10, 1.11 1.13, 1.14, 1.16. Exploratory Data Analysis.

E N D
Chapter 1 - Exploring DataAP StatisticsAmanda Carter Borrowed from Brian Hamilton & Jason Molesky
Chapter 1 Section 1Displaying Distributions with Graphs HW: 1.1(a, b), 1.2, 1.3, 1.4, 1. 5, 1.6 1.8, 1.9, 1.10, 1.11 1.13, 1.14, 1.16
Exploratory Data Analysis • Exploratory Data Analysis: Statistical practice of analyzing distributions of data through graphical displays and numerical summaries. • Distribution: Description of the values a variable takes on and how often the variable takes on those values. • An EDA allows us to identify patterns and departures from patterns in distributions.
Categorical Data • Categorical Variable: Values are labels or categories. Distributions list the categories and either the count or percent of individuals in each. • Displays: BarGraphs & Pie chart(not done in AP)
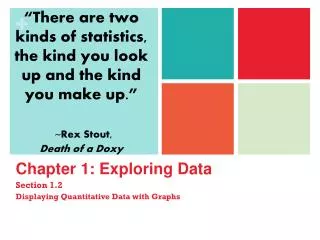
Quantitative Data • Quantitative Variable: • Values are numeric - arithmetic computation makes sense (average, etc.) • Distributions list the values and # of times the variable takes on that value. • Displays: • Dotplots • Stemplots • Histograms • Boxplots
Only organized Data can Illuminate! Your goal is to make neat, organized, labeled graphs that display the distribution of data effectively and provide an insight into patterns and departures from patterns.
Dotplots 34 values ranging from 0 to8. • Small datasets with a small range (max-min) can be easily displayed using a dotplot. • Draw and label a number line from min to max. • Place one dot per observation above its value. • Stack multiple observations evenly.
Stemplots • A stemplot gives a quick picture of the shape of a distribution while including the numerical values. • Separate each observation into a stem and a leaf. • eg. 14g -> 1|4 256 -> 25|6 32.9oz -> 32|9 • Write stems in a vertical column and draw a vertical line to the right of the column. • Write each leaf to the right of its stem.
Stemplots Example1.4, pages 42-43 Literacy Rates in Islamic Nations
Stemplots Note: Stemplots do not work well for large data sets Back-to-Back Stemplots: Compare datasets Splitting Stems: Double the number of stems, writing 0-4 after the first and 5-9 after second.
Histograms • Histograms break the range of data values into classes and displays the count/% of observations that fall into that class. • Divide the range of data into equal-width classes. • Count the observations in each class - “frequency” • Draw bars to represent classes - height = frequency • Bars should touch (unlike bar graphs).
Histograms • Let’s look ex. 1.6, page 49 on 5th grade IQ scores
Histograms TAKE THE DATA AND MAKE CLASSES WITH FREQUENCY • Describe the SOCS or SECS • What do these data suggest?
EDA Summary • The purpose of an Exploratory Data Analysis is to organize data and identify patterns/departures. • PLOT YOUR DATA - Choose an appropriate graph • Look for overall pattern and departures from pattern • Shape {mound, bimodal, skewed, uniform} • Outliers {points clearly away from body of data} • Center {What number “typifies” the data?} • Spread {How “variable” are the data values?}
Let’s Look/Investigate Draw different “shaped” histograms
Cumulative Relative Frequency Graphs(OGIVE) Histograms do a good job of displaying the distribution of values or a quantitative variable, but tell us little about the relative standing of an individual observation. If we want relative standing information, we use an ogive.
Cumulative Relative Frequency Graphs Decide on class intervals and determine the frequency in each class (like with a histogram), but add some additional columns to your table. • Label and scale your axes and title your graph. • Plot a point corresponding to the relative cumulative frequency in each class interval at the left endpoint of the next class interval.
Using Ogives Bill Clinton took office at the age of 46. Find his relative standing for the age he took office. About 10% of all U.S. Presidents were the same age as or younger than Bill Clinton when they were inaugurated.
Chapter 1 Section 2Describing Distributions with Numbers HW: 1.27, 1.29-1.31, 1.33, 1.36, 1.37, 1.41, 1.43, 1.45, 1.46
Describing Distributions with Numbers Shape Center Spread What three things do we always include when describing a distribution of numbers?
Describing Distributions with Numbers Shape- use a histogram Center Spread What three things do we always include when describing a distribution of numbers?
Describing Distributions with Numbers Shape- use a histogram Center- Spread- What three things do we always include when describing a distribution of numbers?
Find the mean for the Fuel Economy for 2004 model motor vehicles You can use a graphing calculator
How Do I write this? • Use your notation and begin the calculation (this tells me you understand the formula) and it will allow for partial credit versus no credit…. • (show example)
Means & Outliers Are there any values that appear to be outliers in our fuel economy data? If so, find the mean without the outlier. The single outlier adds 2 mpg onto the mean highway mileage of 2004 motor vehicles. The mean is sensitive to the influence of a few extreme observations. It is not a resistant measure of center.
Finding the median Median highway mileage for two-seaters Without the Honda insight? • The median is a more resistant measure of center than the mean.
Mean verses Median How do you think the mean and median compare in a symmetric distribution? In a right skewed distribution? Don't confuse the “average” value (mean) with the “typical” value (median).
Mean vs. Median The mean and the median are the most common measures of center. If a distribution is perfectly symmetric, the mean and the median are the same. The mean is not resistant to outliers. You must decide which number is the most appropriate description of the center... MeanMedian Applet
Mean verses Median Generally, when you encounter outliers, correct them if wrongly recorded, delete them for good reason, or otherwise give them individual attention. If correctly recorded outliers cannot be discarded, consider using resistant measures.
Quartiles Quartiles Q1 and Q3 represent the 25th and 75th percentiles. To find them, order data from min to max. Determine the median - average if necessary. The first quartile is the middle of the ‘bottom half’. The third quartile is the middle of the ‘top half’. Q1=23 med Q3=29.5 Q1 Q3 med=79
Finding the Quartiles Find the Quartiles, and IQR.
5-Number Summary, Boxplots We can visualize the 5 Number Summary with a boxplot. 45 50 55 60 65 70 75 80 85 90 95 100 Quiz Scores
Measures of Spread Variability is the key to Statistics. Without variability, there would be no need for the subject. When describing data, never rely on center alone. Measures of Spread: Range - {rarely used...why?} Quartiles - InterQuartile Range {IQR=Q3-Q1} Variance and Standard Deviation {var and sx} Like Measures of Center, you must choose the most appropriate measure of spread.
What about OUTLIERS? THIS HELPS SETS UP “FENCES” TO SEE IF THERE ARE ANY DATA THAT FALLS OUTSIDE..IF SO THEY ARE OUTLIERS
1.5 • IQR Rule To determine outliers: Find 5 Number Summary Determine IQR Multiply 1.5xIQR Set up “fences” Q1-(1.5IQR) and Q3+(1.5IQR) Observations “outside” the fences are outliers.
Outlier Example fence: 19.06-39.99 = -20.93 outliers fence: 45.72+39.99 = 85.71 IQR=45.72-19.06 IQR=26.66 0 10 20 30 40 50 60 70 80 90 100 Spending ($) { } All data on p. 48. 1.5IQR=1.5(26.66) 1.5IQR=39.99
Standard Deviation Another common measure of spread is the Standard Deviation: a measure of the “average” deviation of all observations from the mean. To calculate Standard Deviation: Calculate the mean. Determine each observation’s deviation (x - xbar). “Average” the squared-deviations by dividing the total squared deviation by (n-1). This quantity is the Variance. Square root the result to determine the Standard Deviation.
Standard Deviation Variance: Standard Deviation: Example 1.16 (p.85): Metabolic Rates