Download
1 / 26
260 likes | 400 Views
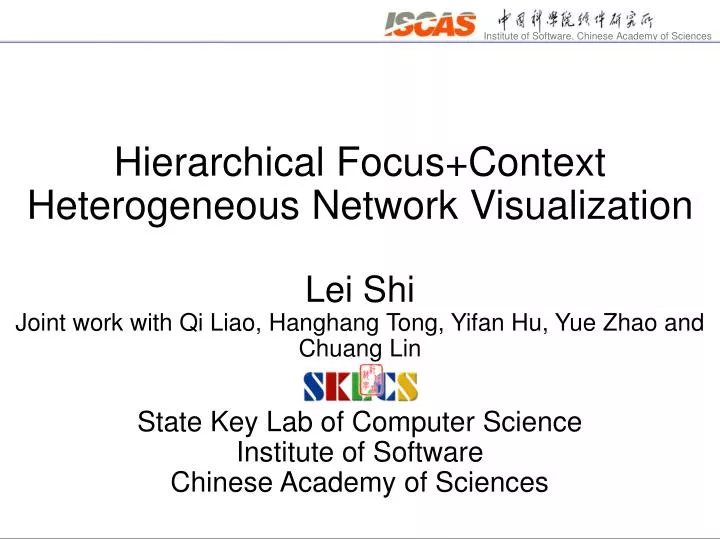
Hierarchical Focus+Context Heterogeneous Network Visualization Lei Shi Joint work with Qi Liao, Hanghang Tong, Yifan Hu, Yue Zhao and Chuang Lin State Key Lab of Computer Science Institute of Software Chinese Academy of Sciences. Network Visualization. Population Migration Networks. Social

E N D
Hierarchical Focus+Context Heterogeneous Network Visualization Lei Shi Joint work with Qi Liao, Hanghang Tong, Yifan Hu, Yue Zhao and Chuang Lin State Key Lab of Computer Science Institute of Software Chinese Academy of Sciences
Network Visualization Population Migration Networks Social Networks Gene Networks Text Networks
Outline • Heterogeneous Network: Our Definition • Problem • Related Work • Methodology Overview • Summarization Algorithms and Performance • Visual Design and Interaction • Case Study • Conclusion
Heterogeneous Network Heterogeneous Networks Networks 中国政府客户场景举例 For InfoVis Attributed Graphs Graphs
Attributed Graph 中国政府客户场景举例 Imagine this as a teacher-student graph Class (Math, Chinese…) Exp. (Senior, Junior…) Teacher Position (Prof., AP…) Gender (M/F) Grading (100, 90+…) Student Degree (PhD, MS…) + + Graph Topology Node Attribute Node Type = Heterogeneous Network
Problem 中国政府客户场景举例 How to visualize heterogeneous networks (attribute graphs) ? On large graphs (102~ 106+ nodes) How to summarize heterogeneous networks? For visual analysis How to navigate the abstraction of heterogeneous networks?
Related Works - Semantic PivotGraph [Wattenberg’06] One attribute: Two attribute:
Related Works - Semantic Dimension selection
Related Works - Semantic OntoVis [Shen et al. ’06] Ontology Graph
Related Works - Topology Cluster-based network visualization [Quigley’00][Auber’03][Abello’06][Shi’09]
Related Works - Topology Compression-based network visualization [Dunne‘13][Dwyer’13][Shi’13]
Related Works - Others • B. Shneiderman and A. Aris. Network visualization by semantic substrates. IEEE Transactions on Visualization and Computer Graphics, 12(5):733–740, 2006. • A. Bezerianos, F. Chevalier, P. Dragicevic, N. Elmqvist, and J. D. Fekete. GraphDice: A system for exploring multivariate social networks. Computer Graphics Forum, 29(3):863–872, 2010. • N. Cao, J. Sun, Y.-R. Lin, D. Gotz, S. Liu, and H. Qu. FacetAtlas: Multifaceted visualization for rich text corpora. IEEE Transactions on Visualization and Computer Graphics, 16(6):1172–1181, 2010. • H. Kang, C. Plaisant, B. Lee, and B. B. Bederson. NetLens: Iterative exploration of content-actor network data. Information Visualization, 6(1):18–31, 2007. • B. Lee, G. Smith, G. Robertson, M. Czerwinski, and D. S. Tan. FacetLens: exposing trends and relationships to support sensemaking within faceted datasets. In Proceedings of the SIGCHI Conference on Human Factors in Computing Systems, pages 1293–1302, 2009. • C. Dunne, N. H. Riche, B. Lee, R. Metoyer, and G. Robertson. GraphTrail: analyzing large multivariate, heterogeneous networks while supporting exploration history. In Proceedings of the SIGCHI Conference on Human Factors in Computing Systems, pages 1663–1672, 2012. • E. Gansner, Y. Koren, and S. North. Topological fisheye views for visualizing large graphs. In IEEE Symposium on Information Visualization (InfoVis’04), 2004.
Motivation Can we combine them? (Semantic-based network visualization & Topology-based network visualization) Why to combine? Semantic-based: high compression rate but coarse-grained Topology-based: low compression rate and too fine-grained
Framework Hierarchical Focus+Context Approach Semantic: Semantic+ Topology: Topology Video Demo: 1:10 ~ 3:58
Summarization Algorithms Level 1/2: Semantic Aggregation (SA) Allow multiple node type/attributes
Summarization Algorithms Level 4: Strong Structural Equivalence (SSE) Mostly topology-based summarization
Summarization Algorithms Level 3: Regular Equivalence Too many regular equivalence possibilities…
Summarization Algorithms Level 3: Relative Regular Equivalence (RRE) Regular equivalence over semantic aggregation A simplification of Regular Interior
Summarization Algorithms Semantic Aggregation Structural Equivalence Relative Regular Equivalence Allow fuzzy equivalence through k-mean
Performance Semantic Aggregation Relative Regular Equivalence Structural Equivalence
Visual Design: OnionGraph By node attribute Onions By RRE By node type Data legend
Interactions Network navigation: Hierarchical focus+context (v.s. hierarchical traversal) Multiple focuses: Through abstraction profiling Network filters: Global node filtering (v.s. local filtering) Neighborhood charting: Show the distribution of neighborhood attributes (roles)
Case Study HUA communication network visual analytics
Conclusion & Contribution • We present OnionGraph: the “first” system that allow networks to be aggregated, visualized and navigated based on both topology and node semantics • We propose a non-trivial hierarchical approach, including a suite of node clustering algorithms, the focus+context interaction and the global filtering operations • We design the “onion” metaphor to represent both the node aggregations and their hierarchy and attribute information
Thank you ! This work is supported in part by NSFC grant 61379088, China National 973 project 2014CB340301, NSF grant IIS1017415, U.S. Army Research Laboratory Cooperative Agreement W911NF-09-2-0053 and DARPA project W911NF-12-C-0028. We thank anonymous reviewers for their instructive comments and suggestions that help to shape this work!