Download
1 / 29
290 likes | 437 Views
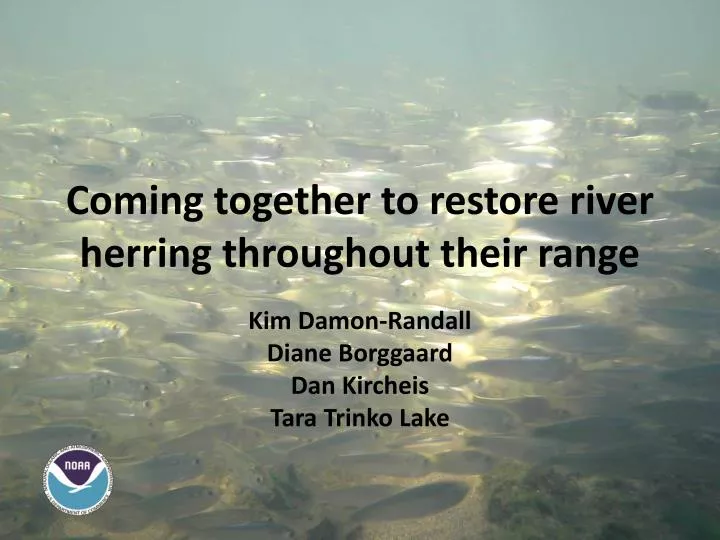
Coming together to restore river herring throughout their range. Kim Damon-Randall Diane Borggaard Dan Kircheis Tara Trinko Lake. ESA Listing Decision Timeline. August 2011 – petitioned by NRDC to list river herring under the ESA

E N D
Coming together to restore river herring throughout their range Kim Damon-Randall Diane Borggaard Dan Kircheis Tara Trinko Lake
ESA Listing Decision Timeline • August 2011 – petitioned by NRDC • to list river herring under the ESA • May 2012 - ASMFC finalized the river herring stock assessment • Summer 2012 – NMFS held workshops to further inform the status review • August 2013 – NMFS published ESA listing determination
ESA Five Factors A. the present or threatened destruction, modification, or curtailment of its habitat or range; B. overutilization for commercial, recreational, scientific, or educational purposes; C. disease or predation; D. the inadequacy of existing regulatory mechanisms; E. other natural or manmade factors affecting its continued existence
Status Review Process • ASMFC completed the benchmark stock assessment for river herring in May 2012. • Summer 2012, three workshops were held focused on the data gaps between the information available in the stock assessment and what is needed for an ESA listing determination. • stock structure • extinction risk • climate change • Reports from the workshops were produced and independently peer reviewed (reports and peer reviews available on our website -http://www.nero.noaa.gov/prot_res/CandidateSpeciesProgram/RiverHerringSOC.htm) • We also sought data and input on Canadian populations as the stock assessment was only for the U.S. portion of both species’ range.
Distinct Population Segment Determination • Genetically unique stock complexes were identified • Insufficient data available to determine significance of the stock complexes as they relate to the species • Evidence of hybridization between the two species • We concluded that it is not possible to delineate DPSs • Four stock complexes were identified for alewife - Canada, Northern New England, Southern New England and Mid Atlantic • Five for blueback herring - Canada, Northern New England, Southern New England, Mid Atlantic, and South Atlantic • Reviewed the status of the species range-wide and for each stock complex to determine risk throughout the species’ range and within portions of the species’ range.
Qualitative threats assessment (QTA) • SRT conducted a QTA where each member ranked the threats to each species using best professional judgment. • Threats that were ranked were identified in the five factor analysis.
QTA Process and Definitions • Each team member was allotted five likelihood points to rank each threat. Threat levels were defined as: • N/A - Not Applicable • 0 - Unknown • 1 Low - It is likely that this threat is not significantly affecting the species now and into the future, and is limited in geographic scope or is localized in the species/stock complex’s range. • 2 Moderately Low - Threat falls between rankings 1 and 3. • 3 Moderate - It is likely that this threat has some effect on the species now and into the future, and it is widespread throughout the species/stock complex’s range. • 4 Moderately High – Threat falls between rankings 3 and 5. • 5 High - It is likely that this threat is significantly affecting the species now and into the future, and is widespread in geographic scope and pervasive throughout the species/stock complex’s range.
QTA Results • Dams and barriers most important threat to alewife and blueback herring populations both range-wide and across all stock complexes (ranking= moderately high to high). • Incidental catch, climate change, dredging, water quality, water withdrawal/outfall, predation, and existing regulation were among the more important threats after dams for both species, and for all stock complexes (ranking= moderately low to moderate). • Water quality, water withdrawal/outfall, predation, climate change and climate variability were generally seen as greater threats to both species in the southern portion of their range. • Commercial harvest was identified as being notably more important in Canada than in the United States.
Criteria to Determine Risk Thresholds • Two tiers eitherused separately or in combination to assess the risk to alewife and blueback herring range-wide and for the individual stock complexes. • Tier A relates to geographic distribution, habitat connectivity and genetic diversity. • Tier B relates to the risk thresholds established for the trend analysis. • Information related to both tiers was assessed to determine if sufficient information was available to make a conclusion under one or both of the tiers. • SRT agreed that given that there are significant uncertainties associated with the available data and a significant number of data deficiencies for both species, it was not necessary to have information to make conclusions under both tiers.
Tier A Important to have 3 contiguous stock complexes that are stable or significantly increasing: • Satisfy the need to maintain both geographic closeness and geographic distance for a properly functioning metapopulation; • Ensure that the recovered population does not include isolated genetic groups that could lead to genetic divergence; • Provide some insurance that the species persists across a relatively wide geographic area supporting diverse environmental conditions and diverse habitat types; and • Ensure that the entire population does not share the same risk from environmental catastrophe.
Tier B Tier B established risk thresholds considered in light of the results of the trend analysis. • Low risk • Coast wide trajectory- Stable to significantly increasing • Stock complex trajectories- All stable to significantly increasing • Moderate-Low risk • Coast wide trajectory- Stable to significantly increasing • Stock complex trajectories- One significantly decreasing, all others stable to significantly increasing • Moderate-High risk • Coast wide trajectory- Stable to significantly increasing • Stock complex trajectories-Two or more significantly decreasing • High risk • Coast wide trajectory- Significantly decreasing • Stock complex trajectories-Three or more significantly decreasing
Trend Analysis • NEFSC conducted an analysis of the trends in relative abundance for each species both range-wide and for specific stock complexes. • Baseline assumed that there was already a significant decline in abundance in both species due to a reduction in carrying capacity and overfishing. • Modeling generated a population growth rate for each species and stock complex. • Data used to inform the modeling for the coast-wide trend - both the inshore and offshore strata for the NEFSC’s spring trawl survey (1976-2012) and fall survey (1975 to 2011). • Stock-specific data from the ASMFC stock assessment and DFO (if available, from 1976 to present) were incorporated in the stock specific model. • Relative abundance of a stock was considered to be significantly increasing/decreasing if the 95% confidence intervals of the population growth rate did not include zero. If the 95% CIs included zero, the population was considered to be stable because the increasing or decreasing trend in abundance was not significant.
Alewife • Coast-wide and Canadian stock complex– Significantly Increasing = across all model runs, the 95% CIsdid not contain zero. Accordingly, the abundance of alewife range-wide significantly increased over time. • Northern New England, Southern New England, and Mid Atlantic – Stable = 95% CIsincluded zero across all model runs, indicating these stocks were not significantly increasing or decreasing in abundance.
Blueback herring • Coast-wide, Northern New England, Southern New England, and South Atlantic – Stable = across all model runs, 95% CIsdid contain zero. Accordingly, the abundance of blueback herring range-wide did not significantly increase or decrease. • Canada – NO DATA • Mid Atlantic – Significantly Decreasing = across all model runs, 95% CIs did not include zero, indicating that the abundance of this stock was significantly decreasing.
Population growth rate maximum likelihood estimates (ML.Est), associated standard errors (Std.Err) and lower and upper 95% confidence intervals (low.CI, up.CI) for each range-wide model run. The preferred model run (lowest AIC) for each species is highlighted in grey.
Population growth rate maximum likelihood estimates (ML.Est), associated standard errors (Std.Err) and lower and upper 95% confidence intervals (low.CI, up.CI) for each stock-specific model run. The preferred model run (lowest AIC) for each stock is highlighted in grey.
Conclusions Alewife – • Tier A: Goal met as sufficient information available to conclude that there are at least three contiguous populations that are stable to significantly increasing. • Tier B: The species is at “Low risk” as the coast-wide trajectory is significantly increasing and all of the stock complexes are stable or significantly increasing. Blueback herring – • Tier A: Insufficient information available to make a conclusion under Tier A as we were unable to obtain data from Canada to determine the population growth rate for rivers in Canada - only able to obtain information for four of the five stock complexes identified for the species. • Tier B: The species is at “Moderate-low risk “as the coast-wide trajectory is stable and three of the four stock complexes are stable. The estimated population growth rate of the Mid Atlantic stock complex is significantly decreasing based on the available information. However, the relative abundance of the species throughout its range (as demonstrated through the coast-wide population growth rate) is stable, and thus, we concluded that the Mid Atlantic stock complex does not constitute a significant portion of the species range.
Listing Decision • Listing as threatened or endangered not warranted for either species at this time • Significant uncertainties associated with data for both species and many data gaps • NMFS committed to working proactively with ASMFC and other partners to fill in data gaps and address uncertainties • NMFS will revisit the status of both species within 5 years
Purpose of proactive conservation effort • Inform future ESA status review • Develop a single, dynamic conservation plan to guide restoration efforts for river herring • Fill in critical data gaps by conducting priority research (e.g., genetics, ocean migration, climate change, etc.) • Implement priority conservation actions • Assess population status/monitor trends • Track and monitor progress and modify efforts as needed
Funding • NMFS PRD provided $95K grant to ASMFC to initiate this effort • FY14 funds possible but not guaranteed • Hope to garner support from outside sources once a plan, funding needs, implementation schedule, etc. have been identified
Technical Expert Working Group (TEWG) • Comprised of experts from: • federal agencies • state agencies (some through the ASMFC TC) • DFO • Native American tribes • academia • environmental organizations • industry (fishing and hydro) • recreational interests
Subgroups Specific subgroups to be identified by TEWG. Possible groups include: • Habitat • Climate change • Predation • Genetics/hybrids/landlocked • Fisheries (state and federal) • Stock status
Goals of subgroups • Identify list of priority conservation efforts that could be undertaken to address particular threat(s) • Identify list of priority research needs, funding required, and develop a plan to implement and monitor research effort
Goals of TEWG • Overarching body to consider work of subgroups • Identify most significant priorities for river herring throughout their entire range • Help develop the conservation plan and monitor progress • Not a consensus group, individual expert opinions and recommendations
Coordination • Coordinating closely with MAFMC/NEFMC effort to address catch cap issue. • Incorporating where possible the ACFHP/TNC effort related to habitat.
Outcome • Dynamic, comprehensive conservation plan