Download
1 / 17
170 likes | 265 Views
Automated Draws vs. Numbered Ball Drawings. Tennessee Education Lottery. Objective and Business Drivers. TCA § 4-51-101 (e): “The corporation shall strive to maximize net lottery proceeds.”. Guidelines for Maximizing Revenues. Statutory Guidelines for Accomplishing this Task:

E N D
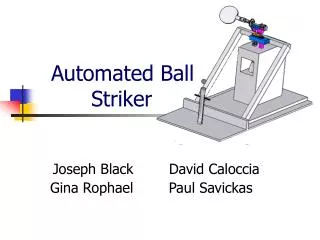
Automated Draws vs. Numbered Ball Drawings Tennessee Education Lottery
Objective and Business Drivers • TCA § 4-51-101 (e): “The corporation shall strive to maximize net lottery proceeds.”
Guidelines for Maximizing Revenues Statutory Guidelines for Accomplishing this Task: • Utilize the private sector perspectives of a large marketing enterprise • Generate more revenue for the education programs funded by Lottery proceeds by realizing operational efficiencies within the corporation • Decrease operational expenses by employing lottery industry best practices
Guidelines for Maximizing Revenues • Maximize participation of minority-owned businesses to achieve a minimum participation goal of 15% • Enhance the business expertise of Tennessee retailers—to assist them in achieving optimal sales levels
Situation Analysis • Contracts for televised numbered ball drawings with all 6 stations expired in March 2007 • Cost to the lottery annually = $253,667 • Projected cost with new television contract terms will be approximately $4,811,115 annually $4.5 million increase
Cost Breakdown Estimated TEL Cost Breakdown to Continue Drawings after March 2007 Source for airtime estimates : Gish, Sherwood & Friends, Inc.
Sales By Product Tennessee Education Lottery Corporation Sales By Product Inception to March 31, 2007 Source: Tennessee Education Lottery
Market Analysis • The trend in the lottery industry is moving away from numbered ball drawings and using the more cost effective automated draws • Domestically, 41 or approximately 95% of lotteries rely on some type of random number generator for online game draws1 • Powerball has recently voted to use a random number generator to determine the Power Play multiplier number 1. This number includes lotteries offering monitor games like keno, and those that conduct raffles using random number generators.
Market Analysis State Lotteries Relying on Automated Draw Technology WA NH ME MT VT ND OR MN ID MA WI SD NY RI WY MI CT IA PA NE NJ NV OH IN MD UT IL D.C. CA CO WV DE VA KS MO KY NC TN AZ OK NM AR SC AL GA MS LA TX FL AK HI 41 Lotteries using automated draws *Rely on RNG for at least one draw game. Non-lottery states Source: State Lottery Websites
Situation Analysis • On July 28, 2007, the Lottery transitioned to automated draw technology for: • CASH 3 • CASH 4 • LOTTO 5 • Lottery uses two automated drawing machines as random number generators, and all 6 television stations air an animated version of the draws
CASH 3 and CASH 4 Sales Summary of CASH 3 and CASH 4 Sales FY08 vs. FY07 (July 28 - October 18) +5% +2% Source: Tennessee Education Lottery
Education Fund Transfers Summary of Transfers to Lottery For Education Account FY07 vs. FY08 (July 1 – September 30) Funding to the Lottery for Education Account increased by nearly 9% compared to same period last year when numbered ball draws were being conducted versus automated draws. Source: Tennessee Education Lottery
Cost Estimates to Return to Live Drawings • Estimates are based on 1,612 shows per year and include satellite transmissions, talent, set, secure storage, cameras, etc. • :30 CASH 3 x 13 per week • :30 CASH 4 x 13 per week • :30 Lotto 5 x 3 per week • :30 Lotto Plus x 2 per week *Note: Annual Cost Totals do not include taxes. Source: Gish, Sherwood & Friends, Inc.
Cost Benefit Analysis Cost Comparison Automated Draw Televised Ball Drawing Production = $628,680 Air Time = $4,270,000 Auditor = $132,850 Draw staff = $117,000 Maintenance= $ 3,817 Projected Annual Cost = $5,152,347 Projected 3 Year Cost = [$15,457,041] Projected 5 Year Cost = [$25,761,735] 1X Purchase = $221,000 Production = N/A Air Time = N/A Auditor = N/A Draw Staff = N/A Maintenance = $61,000 Projected Annual Cost = [$61,000] Projected 3 Year Cost = [$183,000] Projected 5 Year Cost = [$305,000] ANNUAL PROJECTED SAVINGS =[$5,091,347]
Cost Benefit Analysis • Lottery is projected to save $5,091,347 annually using automated draws • Money saved contributes directly to: • Scholarships for Tennessee students to attend higher education institutions in Tennessee. For example, $5,091,347 would fund approximately 1,273 HOPE scholarships of $4,000 each • Pre-K and After-School Programs
Value Summary • Automated draws translate into significant savings on operating expenses • Automated draws / use of RNG technology is becoming a standard cost-effective practice for domestic lotteries • Sales have remained strong since the introduction of the automated draws • Sales for CASH 3 and CASH 4 are up by 5% and 2% respectively (year-over-year FY07 versus FY08)
Value Summary • Lottery funding for education has continued to grow following the switch to automated drawing • Funding to the Lottery for Education Account increased by 8.7% compared to same period last year (July 1-September 30) • Savings by using an automated draw system will translate dollar-for-dollar into education funding