Download
1 / 44
460 likes | 637 Views
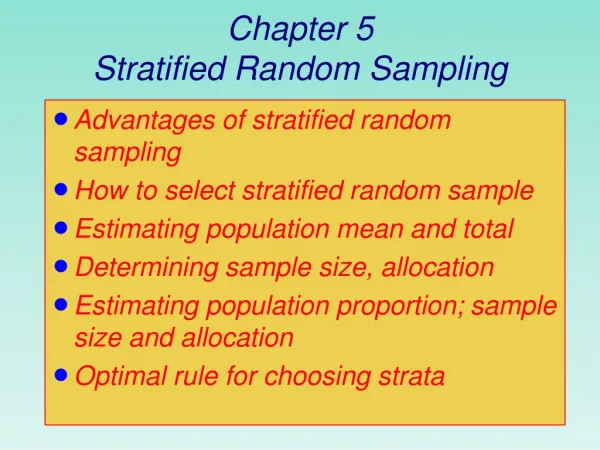
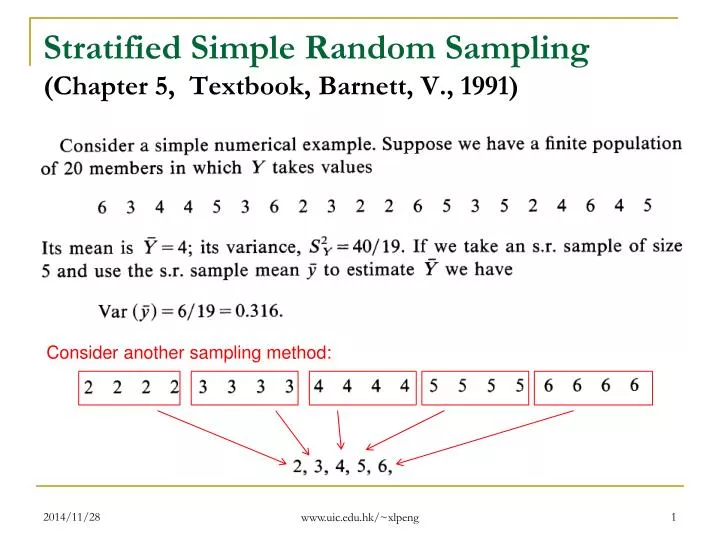
Stratified Simple Random Sampling (Chapter 5, Textbook, Barnett, V., 1991). Consider another sampling method:. Definition: Stratified Random Sample.

E N D
Stratified Simple Random Sampling(Chapter 5, Textbook, Barnett, V., 1991) Consider another sampling method: www.uic.edu.hk/~xlpeng
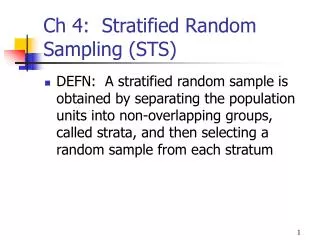
Definition: Stratified Random Sample A stratified random sample is obtained by dividing the population elements into non-overlappinggroups, called strata and then selecting a random sample directly and independently from each stratum. A stratified SRS is a special case of stratified sampling that uses SRS for selecting units from each stratum. www.uic.edu.hk/~xlpeng
Examples of stratification 1.For some types of income and expenditure surveys on households in urban areas, states, provinces, counties, and districts may be considered as the strata. 2. For business surveys on production, and sales, stratification is usually based on industrial classifications like industry type and employment size. . www.uic.edu.hk/~xlpeng
Reasons for using stratified sampling • Allow sub-estimates: they can then be combined to give an overall estimate, e.g. we estimate the income level at district level as well as the whole HK. • Administrative convenience. • Allow different sampling fractions and methods: they may be implemented in different sub-population, e.g. small/large business, private/government housing, urban/rural households. • More efficient estimates: if a heterogeneous population is divided into strata that are internally homogeneous. www.uic.edu.hk/~xlpeng
Some Notations To estimate the population mean of a finite population, we assume that the population is stratified, that is to say it has been divided into k non-overlapping groups, or strata, of sizes: The stratum means and variances are denoted by and www.uic.edu.hk/~xlpeng
Estimation of Population Characteristicsin Stratified Populations www.uic.edu.hk/~xlpeng
Taking a stratified random sample Sample mean and variance for ith stratum are denoted by In each stratum, we have a sampling fraction: www.uic.edu.hk/~xlpeng
Estimating The stratified sample mean is defined as Here we assume the weights Wi=Ni /N is given (known). www.uic.edu.hk/~xlpeng
The mean and variance of Note that Since Because it is assumed that “sampling in different strata are independent”, that is www.uic.edu.hk/~xlpeng
An unbiased estimator of where www.uic.edu.hk/~xlpeng
Some Special cases of www.uic.edu.hk/~xlpeng
Estimator of the “pooled variance” www.uic.edu.hk/~xlpeng
Example: Advertising firm An advertising firm conduct a sample survey to estimate the average number of hours each week that households watch TV. The county contains 2 towns, A and B, and a rural area. Town A is built around a factory and contain mostly factory workers and school-aged children. Town B is an suburb of a city and contains older residents with few children at home. There are 155 households in town A, 62 in town B, and 93 in the rural area. The advertising firm interview n = 40 households with random samples of size n1 = 20 from town A, n2 = 8 from town B, and n3 = 12 from the rural area with proportional allocation. The measurements of TV-viewing time in hours per week, are shown below: www.uic.edu.hk/~xlpeng
Example: Advertising firm www.uic.edu.hk/~xlpeng
Example: Advertising firm (a) Estimate the average TV-viewing time, in hours per week, for all households in the county. (b) In the study, the families of town A tend to be younger and have more children than those of town B. Estimate the difference between the average TV-viewing time, in hours per week, for families of these 2 towns. In both cases, provide an estimate of standard error for the estimation. www.uic.edu.hk/~xlpeng
Example: Advertising firm Solution (a): The population of households falls into 3 groups, 2 towns and a rural area with www.uic.edu.hk/~xlpeng
Example: Advertising firm Solution (b): Since the SRSs chosen within each stratum are independent, the variance of the difference between 2 independent random variables is the sum of their respective variances. The estimate of the difference is www.uic.edu.hk/~xlpeng
Example: Estimation of the population total (c) Estimate the total number of hours each week that households view TV. Provide an estimate of s.e. for the estimation. Solution: www.uic.edu.hk/~xlpeng
Simple random sampling Stratified sampling with proportional allocation www.uic.edu.hk/~xlpeng
(a) When stratum size is large enough: www.uic.edu.hk/~xlpeng
(b) When stratum size is not large enough: The stratified sample mean will be more efficient than the s.r. sample mean If and only if variation between the stratum means is sufficiently large compared with within-strata variation! www.uic.edu.hk/~xlpeng
(15 males and 10 females) Take a stratified random sample with size 5 in each case, that is: www.uic.edu.hk/~xlpeng
Optimum Choice of Sample Size • To achieve required precision of estimation • Some cost limitation The simplest form assumes that there is some overhead cost, c0 of administering The survey, and that individual observations from the ith stratum each cost an Amount ci. Thus the total cost is: www.uic.edu.hk/~xlpeng
I. Minimum variance for fixed cost www.uic.edu.hk/~xlpeng
I. Minimum variance for fixed cost (Cont.) www.uic.edu.hk/~xlpeng
I. Minimum variance for fixed cost (Cont.) Then www.uic.edu.hk/~xlpeng
II. Minimum cost for fixed variance Consider to satisfy for the minimum possible total cost. www.uic.edu.hk/~xlpeng
II. Minimum cost for fixed variance (Cont.) www.uic.edu.hk/~xlpeng
Comparison of proportional allocation and optimum allocation Thus the extent of the potential gain from optimum (Neyman) allocation Compared with proportional allocation depends on the variability of the stratum variances: the larger this is, the greater the relative advantage Of optimum allocation. www.uic.edu.hk/~xlpeng
For optimum allocation: The sample weights are about (0.527, 0.348, 0.124). The required total sample size is now 31, consisting of 16, 11, and 4 for each stratum. By using simple random sampling, we will need 62 samples! www.uic.edu.hk/~xlpeng
Double sampling for stratification • Some practical considerations: • Unknown of Ni and Si2 • Double sampling is a two-phase sampling. • For example, we may call many voters to identify income level (phase 1 sample), when only a few could be interviewed (phase 2 sample) for purposes of completing a detailed questionnaire. • Quota Sampling www.uic.edu.hk/~xlpeng
Double sampling for stratification www.uic.edu.hk/~xlpeng
Post-hoc stratification Suppose plans have been drawn up to conduct a sample survey on a stratified population, and that stratum sizes and stratum variances are known. However, we may not be able to determine in which stratum an observation belongs, until it has been drawn. For example, where strata correspond to different personal details on people-such as their religious beliefs, income levels, and so on. For such factors, published national reports may provide a clear indication of stratum weights (sizes) and variances, but it can be most difficult to sample Individuals from specific strata. Sometimes we may have to draw our sample and stratify it subsequently: that is, carry out a post-hoc stratification. www.uic.edu.hk/~xlpeng
Post-hoc stratification Another possible use of post-hoc stratification is to correct “obvious lack of representativeness” in a s.r. sample. www.uic.edu.hk/~xlpeng
Post-hoc stratification www.uic.edu.hk/~xlpeng
Conclusions on Stratified Sampling: www.uic.edu.hk/~xlpeng
Conclusions on Stratified Sampling: www.uic.edu.hk/~xlpeng