Download
1 / 4
40 likes | 157 Views
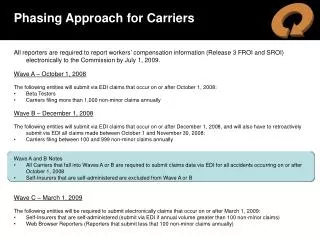
SROI Report Card: Year Six October 2007 – September 30 2008. SROI Report Card: Year End 2008. TurnAround Couriers: Social Mission Overview. Goals. Methods. Success Metrics. Hire couriers and office administrative staff from disadvantaged youth population

E N D
SROI Report Card: Year End 2008 TurnAround Couriers: Social Mission Overview Goals Methods Success Metrics • Hire couriers and office administrative staff from disadvantaged youth population • Provide transitional work experience to enable youth to develop employability skills, a resume and a support network • Enable youth to access the mainstream job market • Enable youth to stabilize life situation, begin a career path and leave the shelter system • Recruit youth from youth shelters and youth serving agencies across Toronto • Provide a real job, not a job training experience • Establish a supportive management environment • Assist youth with planning and making next steps regarding housing and employment • Youth are able to get out of shelter system and into independent housing • Youth meet or exceed job expectations • TurnAround helps youth secure next job and establish a career path • Youth are able to get off and stay off government financial assistance
SROI Report Card: Year End 2008 Enterprise: TurnAround Couriers Location: Toronto ON Date of Inception: October 2002 • Overview of Business • Grew sales from 17% over last year • Assisted over 100 youth since 2002 • Well established courier provider in downtown core to over 500 companies and organizations including several prestigious firms such as RBC • Started to work for first Big Four accounting firm – PwC • Poised to become largest bike courier firm in Toronto measured by number of bikers • Overview of Target Population (sample group) • 100% of new target hires recruited from youth employment service agencies • 86% target hires are male • Average age: 21 years • 100% unemployed at time of hire • 36% receiving social assistance at time of hire • 29% did not complete high school • Employment Outcomes (sample group) • Increased target/non target staff ratio from 75% to 83% over 6 year period • Grew average number target employees from 4.5 in year 1 to 10 in year 6 • Grew target hire annual wage/salary pay out from $93,500 in year 1 to 210,547 in year 6 • Average annual income of target employees by year 6 – $21,000 • 64% target hires continue to work at TurnAround Couriers • 21% target hires left TurnAround Couriers this year went onto employment in the Canadian Forces, larger courier firm and organic farming • 14% went onto further education • Sustainable Livelihood Outcomes (sample group) • Target youth reported they are able to save money, open bank accounts, eat healthier and move into better housing arrangements while working at TurnAround Couriers • Target youth able to define and plan next employment and/or education steps while working at TurnAround Couriers with the help and support of the Founder and General Manager • 80% receiving social assistance at time of hire able to eliminate need and replace with employment income
SROI Report Card: Year End 2008 Definitions and Methodology Total cash injections + Cumulative operating losses = Total Investment Required $100,000 + $81,618 = 181,618 Total Annual Government Financial and/or Social Service Assistance Before Hire - Annual Income Tax Paid Before Hire + Annual Income Tax Paid After Hire / Number Target Employees in Sample = Average Change in Societal Contribution $114,772 / 14 = $8,198 Average Chance in Societal Contribution X Average Number of Target Employees $8,198 x 10 = $81,980 Total Investment (over 6 years) / Total Cost Savings to Society (over 6 years) x 6 years $181, 618/ 367,060 x 6 = 3 years Total Change in Societal Contribution or Cost Savings to Society (over 6 years) / Total Investment (over 6 years) $367,060 / $181,618 = 2.02 or 200% • Total Investment Required • Represents all cash injections in the business + annual operational losses • Average Change in Societal Contribution (Target Employees) • Difference between the societal cost before hire (shelter, income assistance, employment services) vrs the societal benefit (taxes paid, eliminating need for government income and services) after hire • Current Year Cost Savings to Society • Dollars saved that year by employing target group and eliminating or lessening government financial assistance • Cumulative Societal Payback Period • The number of years it would take for the social returns to equal the financial investment made in Y1through Y6 combined • Cumulative SROI • Average social return on investment generated by year 1 through 6 change in target employee financial position • Data Gathering Process • The sample group was drawn from youth that worked at TurnAround Couriers for three months or more in Year 6 • Target employees complete surveys and participate in telephone interviews to obtain socio-economic and sustainable livelihood data • Only target employees who are employed for three months or more are considered for SROI calculations